
XRP Price Forms A Bullish Engulfing As Binance Reserves Dip
XRP price could be about to rebound in the near term after forming a bullish engulfing pattern as key catalysts like falling Binance reserves and ETF inflows align.
Summary
- XRP price has formed several bullish chart patterns on the daily chart.
- The supply of XRP tokens in exchanges has dropped to the lowest level in months.
- Spot XRP ETF inflows have continued rising this week.
The Ripple (XRP) token was trading at $1.8885 at press time, up slightly from the intraday low of $1.7758.
A potential catalyst for the XRP price is third-party data showing that the token’s supply on exchanges has continued to fall.
Data compiled by CryptoQuant indicate that the supply has been in a pronounced downward trend since peaking in October this year. It has now reached its lowest level of the year.
https://twitter.com/InvestWithD/status/2001679191448953281
Falling Binance exchange reserves are significant because it is the largest venue for XRP trading. Data compiled by CMC shows that XRP’s volume in Binance on Friday stood at over $600 million, much more than Upbit’s $355 million.
Declining exchange balances indicate that investors are moving their tokens to cold storage, suggesting they expect the tokens to rebound over time.
The falling exchange balances is happening at a time when XRP ETF demand remains substantial. Data compiled by SoSoValue indicate that spot XRP ETFs had over $68 million in inflows this week, bringing the cumulative net inflows to $1.06 billion. These inflows brought the total assets to $1.14 billion.
XRP ETF inflows this week were notable, occurring when Bitcoin and Ethereum funds shed assets. Ethereum and Bitcoin ETFs have shed over $568 million and $338 million, respectively.
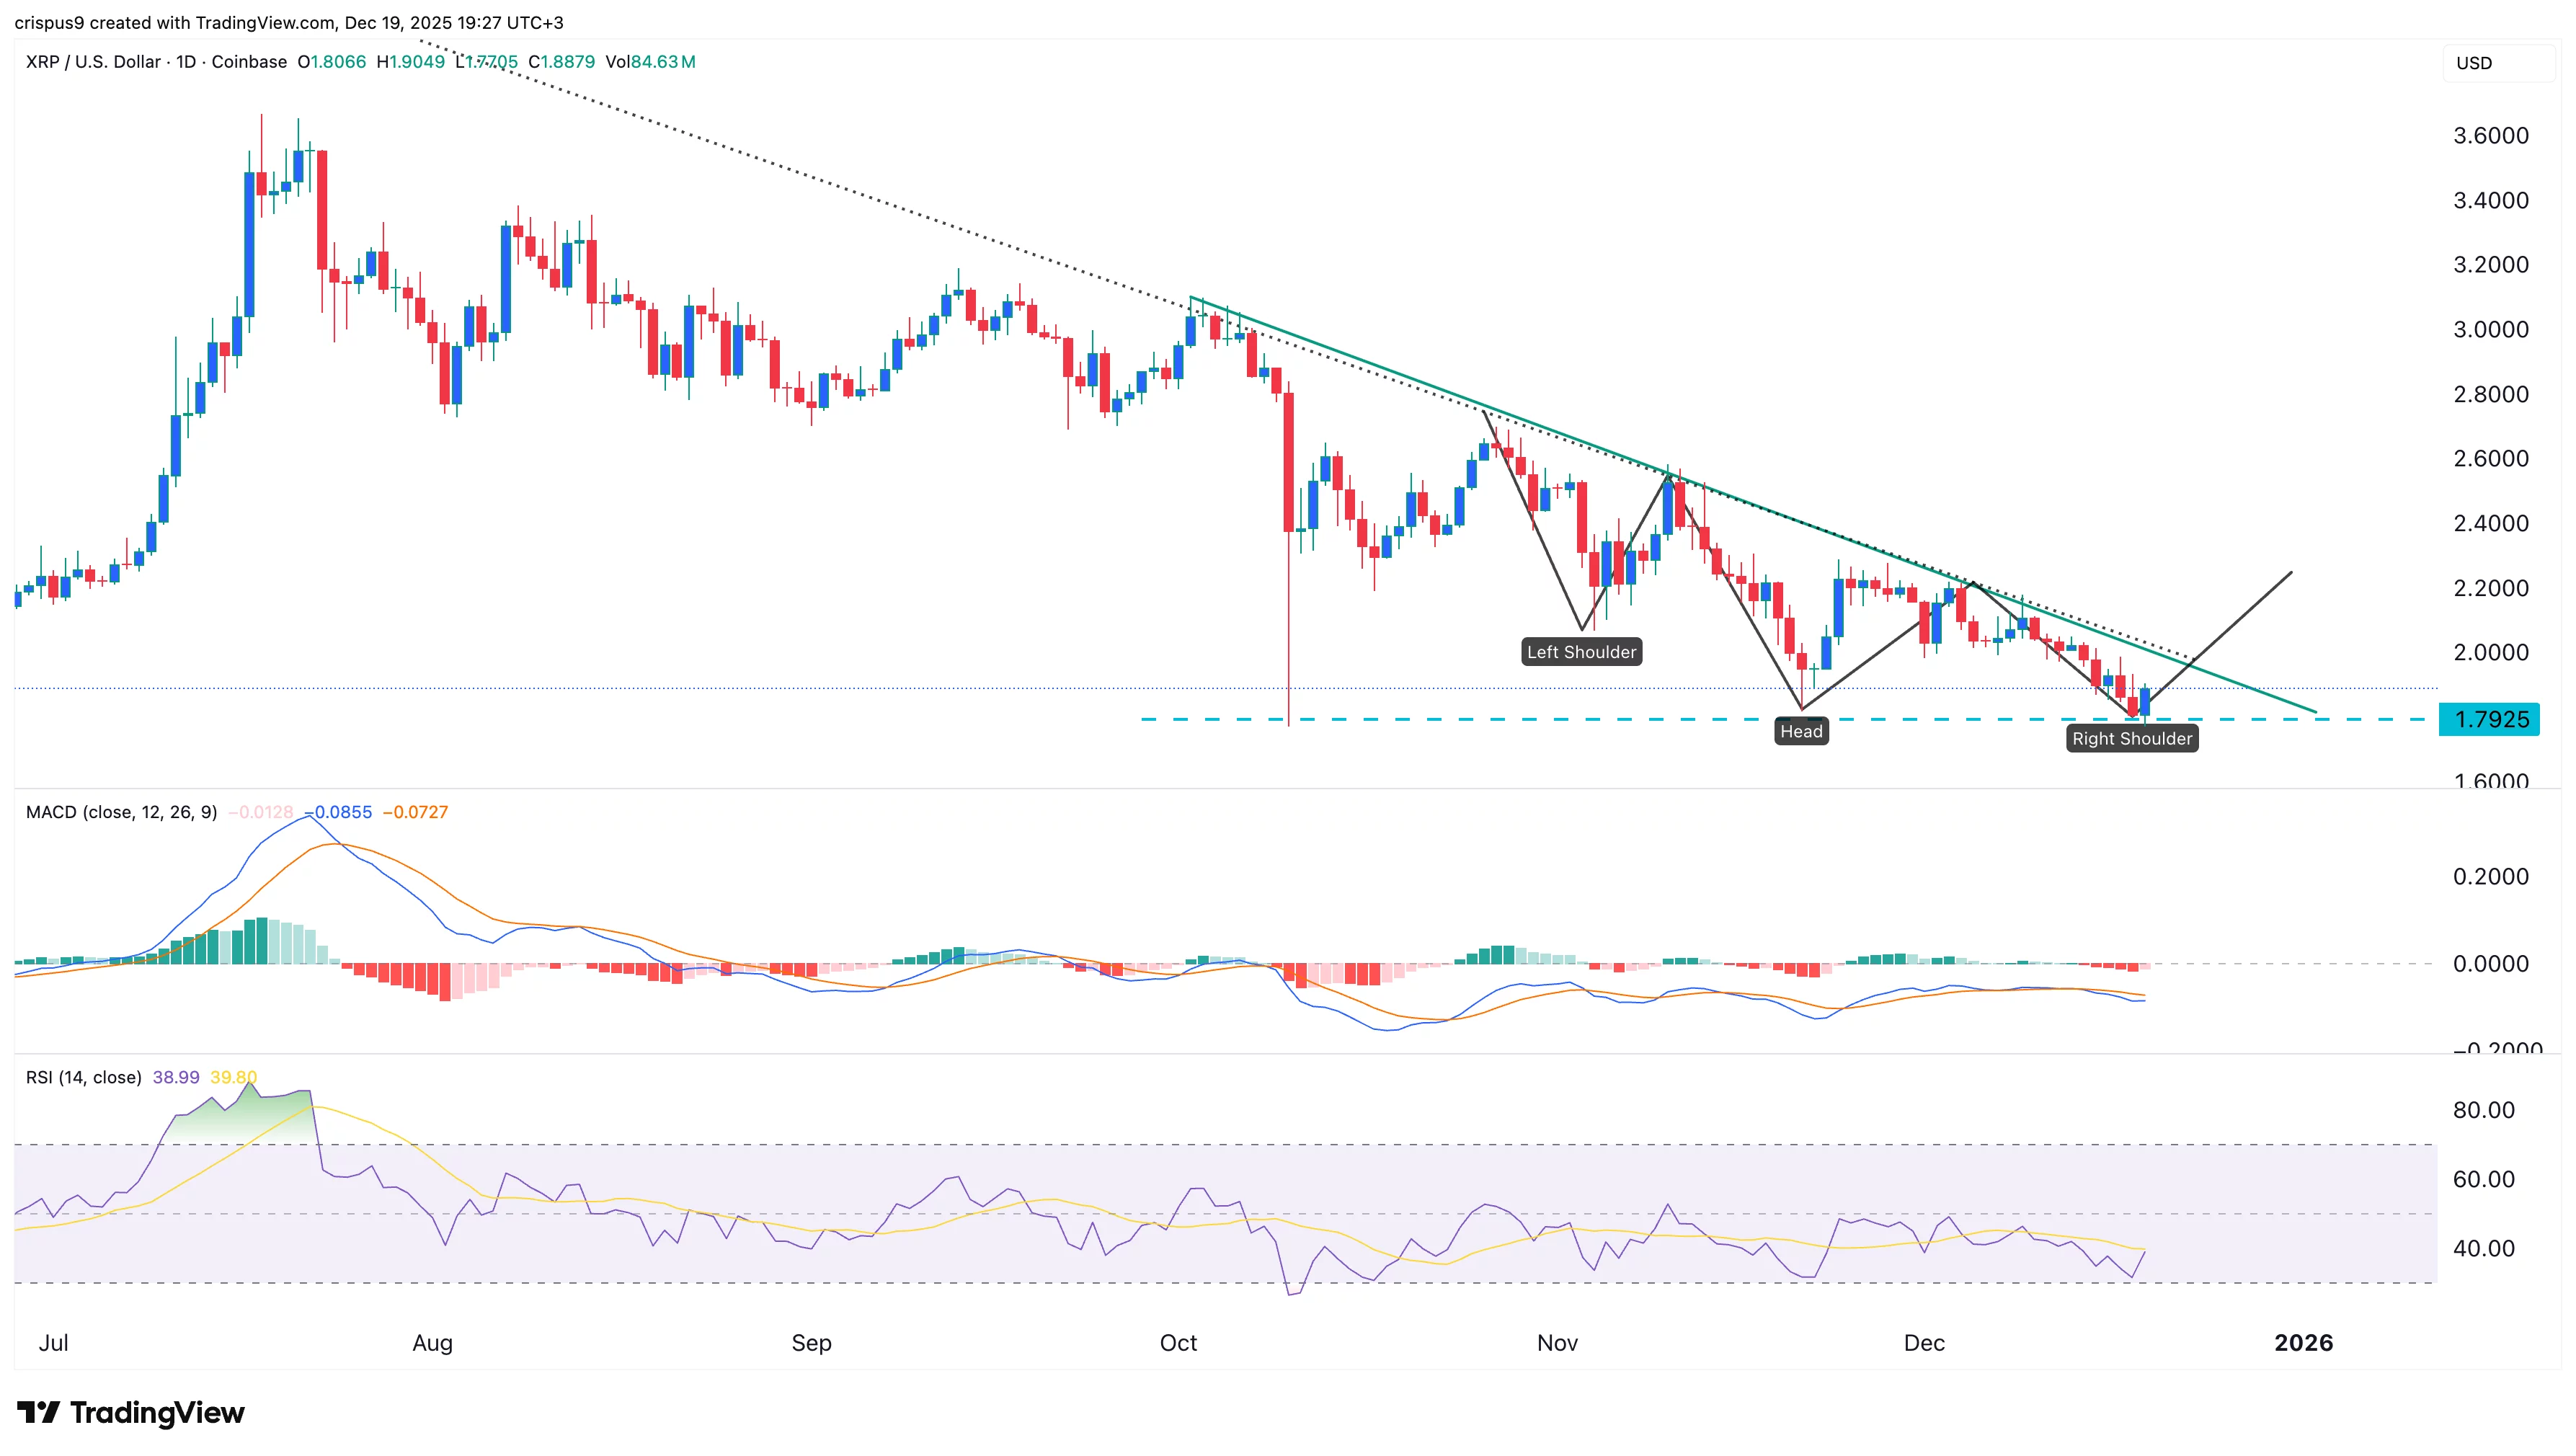
The daily timeframe chart shows that the XRP price settled at a crucial support level this week. Its lowest level coincided with the lowest points in October and November.
Ripple price has also formed an inverse head-and-shoulders pattern, a common bullish reversal sign. In this case, its shoulder is the descending trendline that connects the highest swings since October.
A closer look shows that the token has formed a bullish engulfing pattern, consisting of a large bullish candle that fully covers a small bearish one. It is one of the most common bullish reversal signs in technical analysis.
Crypto Treasuries Chase A New Kind Of Capital
There is a peculiar irony at the heart of the crypto treasury movement. Companies that staked their futures on digital a... Read more
What Strategy's Bitcoin Sale Really Tells Us
There is a moment in every bull run when the narrative starts to fray. Not with a crash, not with a scandal, but with so... Read more
The Clock Is Ticking On UK Stablecoins
The world is not waiting for Britain to make up its mind. While the United States and the European Union have spent the ... Read more
From Cypherpunk To Citadel
How Crypto Moved from the Wild West to the Mainstream Financial SystemA long-form analysis of Bitcoin's journey from fri... Read more
Tether Plots Global Expansion
Stablecoin leader seeks to transform itself from crypto plumbing provider into a broad “freedom tech” conglomerateTe... Read more
World Liberty Seeks Federal Trust Charter
World Liberty Financial, the crypto venture backed by the Trump family, has applied for a US national bank trust charter... Read more