
Shiba Inu Price Nears Big Move As Whale Activity Dries

The Shiba Inu price dropped by over 3% on Sunday, erasing some of the gains made on Friday following Jerome Powell’s statement at the Jackson Hole Summit.
Summary
- Shiba Inu price retreated on Sunday as Friday’s gains faded.
- Smart money and whale activity has faded this month.
- Shibarium activity has also weakened, leading to lower fees.
Shiba Inu’s (SHIB) retreat mirrored moves by Bitcoin (BTC) and other top altcoins like Ethereum (ETH) and Ethena (ENA). It also coincided with falling whale and smart money activity.
Nansen data shows that savvy money investors hold 40.42 billion tokens today, down from the July peak of 48.6 billion. Their holdings have remained stagnant since Aug. 5.
Similarly, whales hold 45 billion SHIB coins, down from last month’s high of 47.6 billion. The ongoing trend is a sign that top investors are concerned about SHIB’s trajectory following its 60% crash from its November highs.
The ongoing Shiba Inu price crash also coincided with a decline in activity within its ecosystem. Data shows that Shibarium, its layer-2 network that launched in 2023 is not seeing significant activity.
The total value locked in the network dropped to $1.79 million, and there is no stablecoin activity. There are only 17 DeFi protocols in its ecosystem, including Shibarium, WoofSwap, ChewySwap, and DogSwap.
Shibarium was created to enhance Shiba Inu’s ecosystem by transitioning it from a mere meme coin into a utility token. Its success would also contribute to Shiba Inu’s scarcity as some of the fees are converted from BONE to SHIB and incinerated.
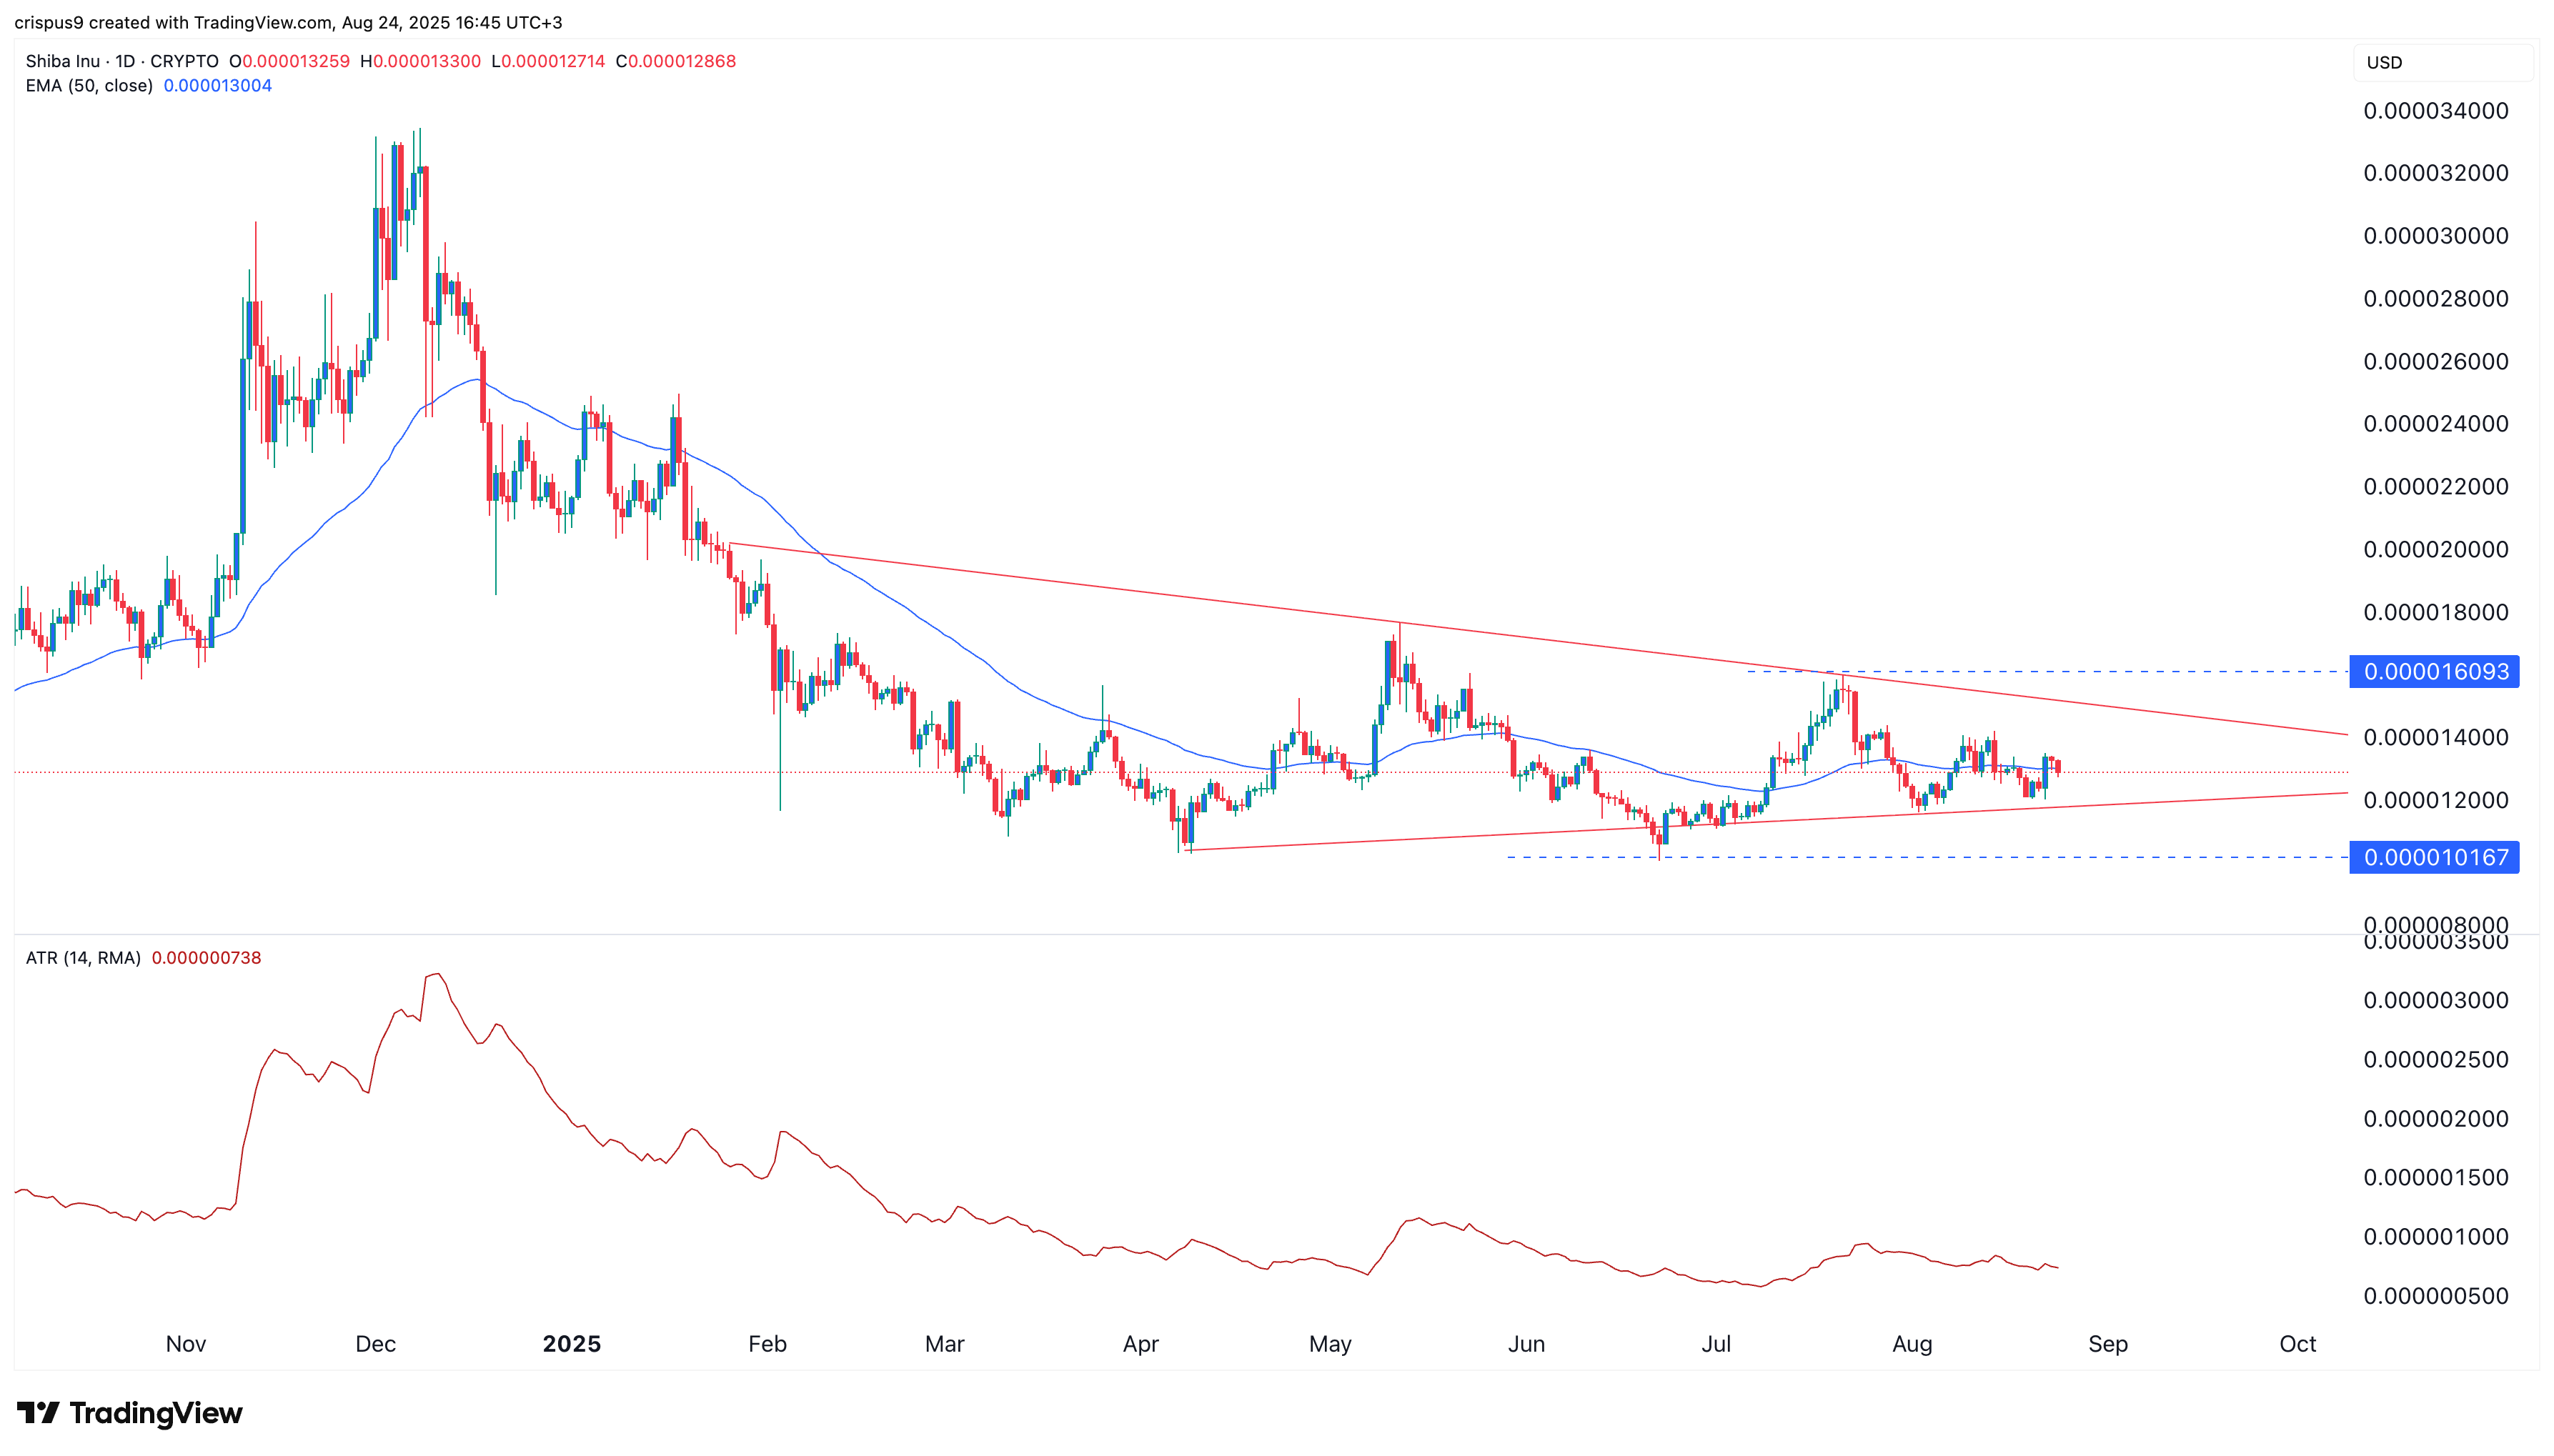
The daily timeframe chart indicates that the SHIB price has been moving sideways over the past few days. As a result, it has consolidated along the 50-day and 100-day Exponential Moving Averages, and its Average True Range has decreased, indicating low volatility.
The Shiba Inu price has also formed a symmetrical triangle pattern whose two lines are about to converge. In most cases, bullish or bearish breakouts happen when the two lines converge.
A bullish breakout will see it rise to the key resistance level at $0.00001600, its highest point on July 22. On the other hand, a drop could push it to $0.00001015, its lowest level in June.
Crypto Treasuries Chase A New Kind Of Capital
There is a peculiar irony at the heart of the crypto treasury movement. Companies that staked their futures on digital a... Read more
What Strategy's Bitcoin Sale Really Tells Us
There is a moment in every bull run when the narrative starts to fray. Not with a crash, not with a scandal, but with so... Read more
The Clock Is Ticking On UK Stablecoins
The world is not waiting for Britain to make up its mind. While the United States and the European Union have spent the ... Read more
From Cypherpunk To Citadel
How Crypto Moved from the Wild West to the Mainstream Financial SystemA long-form analysis of Bitcoin's journey from fri... Read more
Tether Plots Global Expansion
Stablecoin leader seeks to transform itself from crypto plumbing provider into a broad “freedom tech” conglomerateTe... Read more
World Liberty Seeks Federal Trust Charter
World Liberty Financial, the crypto venture backed by the Trump family, has applied for a US national bank trust charter... Read more