

The cryptocurrency market witnessed a renewed correction in the second half of December following the U.S. Fed decision for a 25 Bps rate cut. However, the bearish momentum had a higher impact on meme coins due to their volatile nature and susceptibility to speculative trading. Thus, the Pepe coin price shows the risk for a $0.00001 breakdown amid whale selling and bearish pattern formation.
According to Coingecko, the meme market cap stands at $105 Billion, while the 24-hour trading volume is at $28 billion.
Key Highlights:
- The formation of a double-top pattern could drive an extended correction below $0.00001
- The $0.000017 and $0.0000128, coinciding with the 100-and-200-day exponential moving average, stand as key pullback support for crypto buyers.
- A bearish divergence in the Relative Strength Index hints at weakening bullish momentum in Pepe coin price
Whale Exit Could Trigger Further PEPE Coin Price Decline
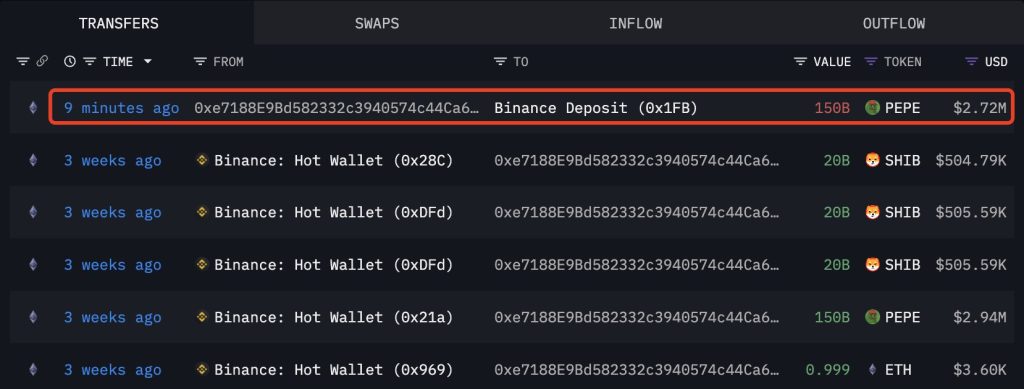
Amid a market downturn, a prominent whale moved 150 billion PEPE tokens, valued at $2.72 million, into Binance in a bid to mitigate losses. This follows an earlier transaction on November 28, where the whale had withdrawn 150 billion PEPE ($2.94 million) and 60 billion SHIB ($1.52 million) from Binance.
According to lookonchain data, the whale faces significant unrealized losses of $219,000 on PEPE and $136,000 on SHIB. If the PEPE price continues its downward trend, the whale may liquidate its position further. Historically, such whale exits have often coincided with extended market corrections and bearish sentiment.
Double Top Reversal Pattern Hints Major Breakdown
Following Powell’s hawkish speech, the Bitcoin price recorded a sharp below $100k, accelerating a correction trend in the altcoin market. Thus, the frog-themed Pepe showcased a sharp drop from $0.000022 to $0.0000174— a 22% decrease— in the last 48 hours.
A daily chart analysis of this correction shows the form of a classic reversal pattern called double top. The chart pattern is characterized by two major reversals from the common resistance zone, developing an ‘M’ shaped letter.
The RSI indicator displaying a lower-high formation while the price reaches a higher peak highlights a bearish divergence, signaling a loss of bullish strength.
Under the influence of this setup, the Pepe coin price could pierce the neckline support of $0.0000172, intensifying the market selling pressure. The post-breakdown fall could push the asset 55% down to hit $0.0000077.

Alternatively, if the buyers defend the $0.000017 support, the price trajectory would shift sideways, building the bullish momentum for the next leap.
Also Read: Crypto Liquidations Reach $1.1B, Bitcoin, Ether, XRP Crash!