Though Gold Prices Bounce Higher, Wait For A Dip

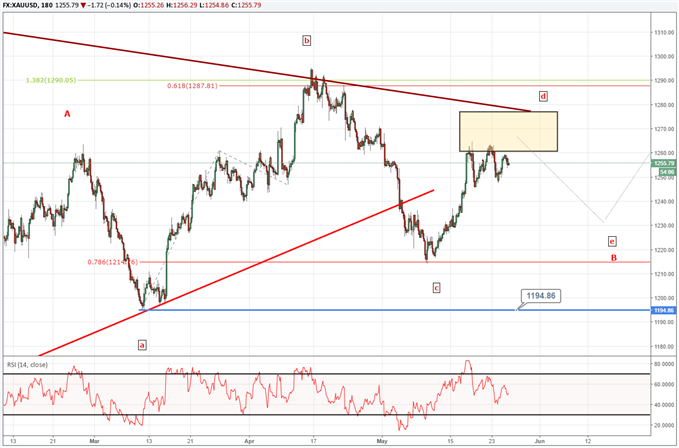
Gold prices appear to be grinding sideways in an Elliott Wave triangle. Currently, the range boundary on gold prices are locked between $1214 and $1295.
According to the Elliott Wave model we are following, we previously identified the potential for a jump up to $1260. Now that we have arrived, what is next for gold prices?
The model continues to allow one more bump higher towards $1280. Though we are not certain of the odds of that happening, the higher probability opportunity is buying at lower levels. Eventually, we are anticipating prices to dip back towards $1230-$1240 before accelerating higher.

As you can see above, it appears we are in the latter stages of the ‘d’ leg of the Elliott Wave triangle. That implies another shallow dip in the ‘e’ wave to finalize the triangle pattern. For the pattern to remain valid as pictured above, prices will need to hold above $1214. Using wave relationships, gold prices may dip back to $1230-$1240.
The IG Client sentiment reading for gold is at +3.22, which is quite a bit lower than during our previous report. The amount of traders net long has been decreasing. We use sentiment as a contrarian indicator that suggests there may be another high coming in gold. Follow this live reading and learn how to trade with sentiment at this link.
Though an immediate break above $1295 cannot be ruled out since the larger trend is incomplete, we think gold prices continue to chop sideways to finalize the triangle pattern first.
This is a shorter term outlook for gold. Read our Q2 gold price forecast to see what is expected through the end of June.
---Written by Jeremy Wagner, CEWA-M
Discuss this market with Jeremy in Monday’s US Opening Bell webinar.
Follow on twitter @JWagnerFXTrader .
Join Jeremy’s distribution list.
USD/CAD Elliott Wave picture implies continued weakness over time.
The Elliott Wave model for crude oil prices points sideways to higher levels.
USDJPY’s Elliott Wave model shows it is vulnerable to a 110.60 retest.
EUR/USD has been ripping lately. Read more on the EURUSD Elliott Wave picture.
Read the recent Dow Jones Elliott Wave article.
Copper's Comeback: Inside BHP And Lundin's Argentine Asset Acquisition
Copper, often dubbed "the metal of electrification," is experiencing a resurgence in demand due to its critical role in ... Read more
Revitalizing Commodities: How Clean Energy Is Breathing New Life Into A Stagnant Market
The commodities market, traditionally a cornerstone of investment portfolios, has experienced a decade of stagnation. Ho... Read more
European Airports Disrupted By Escalating Climate Protests
Climate activists have escalated their protests at European airports, blocking runways and causing flight disruptions in... Read more
Hungary's Russian Oil Dilemma: Why Brussels Is Cautious In Offering Support
Hungary's reliance on Russian oil has led it to seek support from Brussels to ensure continued access to this crucial en... Read more
Unveiling China's Secret Commodity Stockpiles: What Lies Ahead?
Xi Jinping's extensive reserves of grain, natural gas, and oil hint at future challenges.In a move shrouded in secrecy, ... Read more
Copper Miners Brace For Industry Overhaul As End Users Seek Direct Deals
The copper mining industry is bracing for a significant overhaul as end users, including cable manufacturers and car com... Read more

