
Gold Prices Advance In Preparation For $1296 Retest

The tension rising in the Korean peninsula has traders bidding up gold prices. We have been maintaining for three months now how our models were showing the gold price pattern was incomplete to the upside on an eventual break above $1300. As gold trades at $1275, will this current rise hold enough energy to break higher?
We can’t say for sure if the current trend is going to break higher, but the patterns are longer term bullish. It appears gold prices are consolidating in a sideways triangle. If this pattern holds, then gold would need to hold below $1296 and continue sideways. It does appear as though we are nearing the end of the triangle pattern. Therefore, if we do get another dip into the $1215-$1245 zone, that dip may be the final wave of the triangle offering bullish traders an opportunity.
To learn more about trading Elliott Wave triangle, view this hour long webinar recording solely covering the triangle pattern with a free registration. Don’t have time for the video recording, grab your beginner and advanced Elliott Wave guides here.
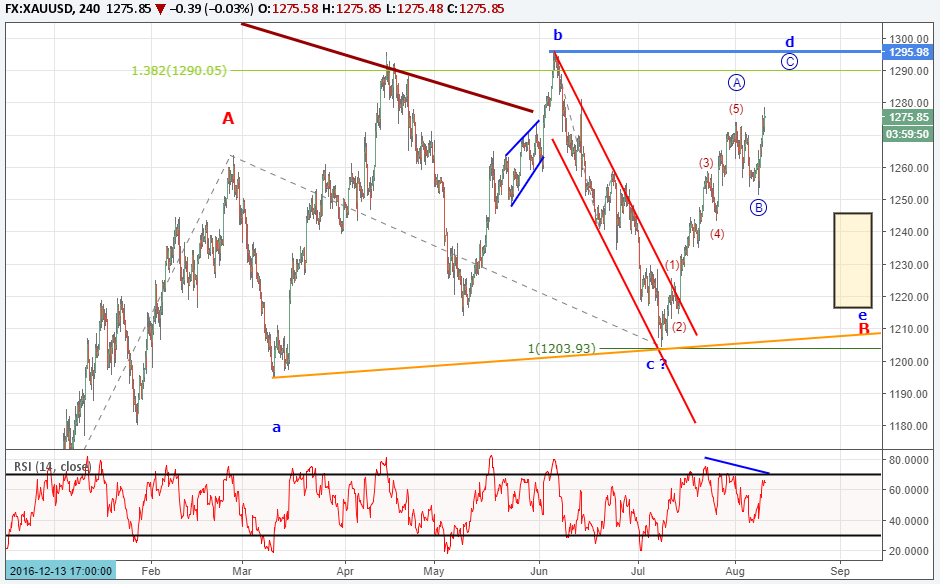
If we do get an immediate break above $1296, that would imply that the ‘B’ wave ended in early July as a flat pattern and the ‘C’ wave at one larger degree is working itself higher towards $1345.
The IG Client sentiment reading for gold is at +2.09. The number of traders net long gold have decreased since the beginning of July. This could be a subtle clue for bullish traders as the sentiment reading has been dropping from even more extreme levels. Follow live trader positioning in gold.
$1204 is a key level and our models show this is a lower probability move. A break below $1204 would cause us to reconsider the bigger picture pattern and we would turn neutral the yellow metal.
Bottom line, we are anticipating gold prices to find continue to be supported on an eventual break above the $1296 ceiling.
This is a shorter term outlook for gold. Read our quarterly gold price forecast to see what may be influencing the longer term cycles.
---Written by Jeremy Wagner, CEWA-M
Discuss this market with Jeremy in Monday’s US Opening Bell webinar.
Follow on twitter @JWagnerFXTrader .
Join Jeremy’s distribution list.
Crude oil prices stuck in a sideways triangle consolidation.
Copper's Comeback: Inside BHP And Lundin's Argentine Asset Acquisition
Copper, often dubbed "the metal of electrification," is experiencing a resurgence in demand due to its critical role in ... Read more
Revitalizing Commodities: How Clean Energy Is Breathing New Life Into A Stagnant Market
The commodities market, traditionally a cornerstone of investment portfolios, has experienced a decade of stagnation. Ho... Read more
European Airports Disrupted By Escalating Climate Protests
Climate activists have escalated their protests at European airports, blocking runways and causing flight disruptions in... Read more
Hungary's Russian Oil Dilemma: Why Brussels Is Cautious In Offering Support
Hungary's reliance on Russian oil has led it to seek support from Brussels to ensure continued access to this crucial en... Read more
Unveiling China's Secret Commodity Stockpiles: What Lies Ahead?
Xi Jinping's extensive reserves of grain, natural gas, and oil hint at future challenges.In a move shrouded in secrecy, ... Read more
Copper Miners Brace For Industry Overhaul As End Users Seek Direct Deals
The copper mining industry is bracing for a significant overhaul as end users, including cable manufacturers and car com... Read more