
USDJPY Elliott Wave Analysis: Trying For Higher Levels

USDJPY Elliott Wave Talking Points:
- The height of the current rally is normal within the context of a bearish Elliott wave zigzag
- If this pattern unfolds, then Elliott wave forecasts a bearish trend to 111 and possibly 108
- A break above 114.56 negates this pattern and we’ll reconsider further bullish opportunities
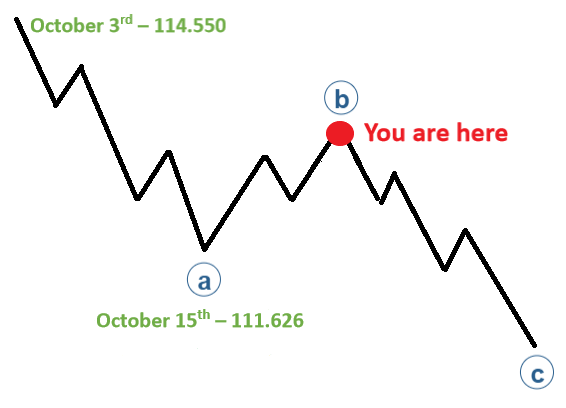
USD/JPY has been caught within an upward correction that we believe will resolve in a bearish turn soon. Bigger picture, we think USDJPY is in a downward corrective cycle since October 3 that may drive the pair towards much lower levels.
The current Elliott Wave for USDJPY
New to Elliott wave analysis? On page 4 of our Elliott wave beginners guide, we list out the rules and guidelines so you can properly label your own charts.
We are anticipating an a-b-c zigzag pattern lower that began October 3. This zigzag pattern would make up the ‘E’ leg of a larger triangle pattern that began from the 2015 high. It appears as though wave ((b)) of the zigzag is close to a termination point so that makes the current Elliott wave ((b)) of E. If this pattern is the correct one, then USDJPY will move lower in wave ((c)) of E that retests the 111 lows and possibly lower levels.
Why does Elliott Wave Theory identify a reversal near current levels?
Since the trend that began October 3 appears to be a bearish impulse wave into the October 15 low, it is highly probable that we will witness a subsequent three-wave bounce as a partial retracement. The Fibonacci 78.6% retracement is located near 113.92 and is considered the retracement of last resort. If USDJPY does not respect this level, then we will more highly consider other alternate Elliott wave patterns.

If this pattern does hold and a bearish reversal embarks soon, then we will anticipate wave ((c)) covering a distance of equal or Fibonacci proportions to the length of wave ((a)) in the zigzag.
If USDJPY does continue higher and break above 114.56, then this Elliott wave pattern is voided and we will consider other alternate counts.
Elliott Wave FAQs
How does Elliott Wave theory work?
Elliott Wave theory is a trading study that identifies the highs and lows of price movements on charts via wave patterns. Traders analyze the waves for 5-wave moves and 3-wave corrections to determine where the market is at within the larger pattern. Additionally, the theory maintains three rules and several guidelines on the depth of the waves related to one another. Therefore, it is common to use Fibonacci with Elliott Wave analysis. We cover these topics in our beginners and advanced Elliott Wave trading guides.
---Written by Jeremy Wagner, CEWA-M
Jeremy Wagner is a Certified Elliott Wave Analyst with a Master’s designation. These articles are designed to illustrate Elliott Wave applied to the current market environment. See Jeremy’s bio page for recent Elliott Wave articles to see Elliott Wave Theory in action.
Communicate with Jeremy and have your shout below by posting in the comments area. Feel free to include your Elliott Wave count as well.
Discuss this market with Jeremy in Monday’s US Opening Bell webinar.
Follow on twitter @JWagnerFXTrader .
Challenges And Rewards Of Expat Life In Asia
The freedoms, novelties, and richness of new experiences that typify the expat way of living constitute the crux of the ... Read more
NZD/USD Wedge Breakout Back In Play As US Dollar Strength Cools
NZD/USD is looking higher ahead of Australian and New Zealand inflation expectations. Meanwhile, China's credit conditio... Read more
Australian Dollar Outlook: AUD/USD Eyes Westpac Consumer Confidence
The Australian Dollar is seeing a mild rebound following a Rising Wedge breakdown. AUD/USD may see volatility on Westpac... Read more
NZD/USD May Weaken As Goldman Sachs Downgrades Chinese Growth Outlook
The New Zealand Dollar fell overnight against the US Dollar as Covid and Chinese economic downgrades weighed on sentimen... Read more
AUD/USD Threatens Key Technical Level As Chinese Inflation Data Nears
AUD/USD is threatening a breakdown as prices test support at the floor of a Rising Wedge chart pattern. Chinese inflatio... Read more
Australian Dollar Forecast: AUD/USD May Move On RBA, Covid, China, US NFPs
The Australian Dollar is benefiting from a rebound in sentiment after Wall Street closed higher. AUD/USD looks to the RB... Read more