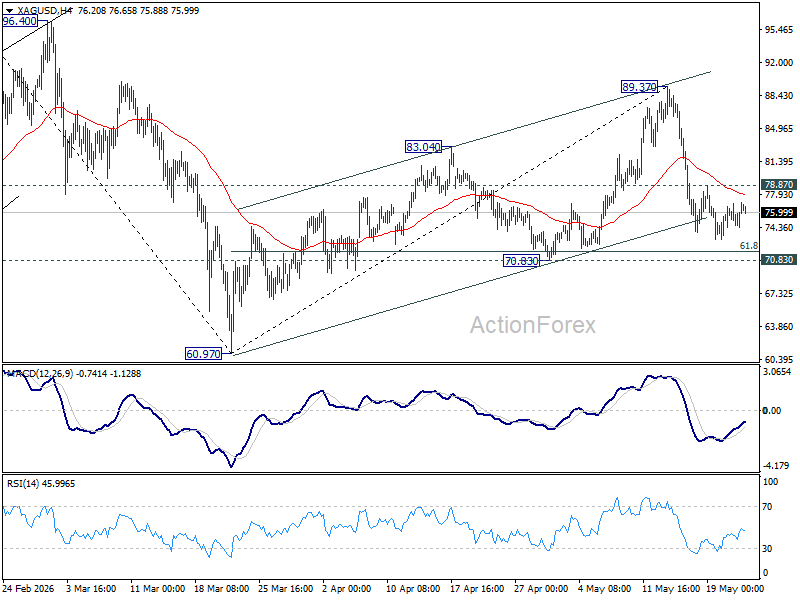
Silver has endured a violent reversal in the past two weeks, swinging from near $90 to the mid-$70s as geopolitical panic surrounding the Iran conflict intensified and then eased sharply. The initial steep decline was fueled by fears of an imminent US strike on Iran earlier in the week and a potential collapse of the fragile ceasefire framework, which sent Brent crude above $111. But sentiment shifted quickly after the White House postponed the strikes, and signaled negotiations with Tehran were entering the “final stages”.
The more important story may be what did not happen. Despite intense liquidation pressure across commodities, rates, and broader macro markets this week, Silver refused to break decisively below the mid-$73 area. That resilience reinforces the view that a structural physical-demand floor remains firmly intact around the $70–74 corridor. Industrial demand tied to solar photovoltaics and electrification continues to outpace mine supply in 2026, creating a persistent structural deficit that long-term buyers appear willing to defend aggressively during sharp pullbacks.
As a result, Silver may now be entering a broad consolidation phase. Unless there is a meaningful resolution to the Iran conflict and a deeper unwind in inflation fears there is unlikely to be enough momentum to sustain a breakout above $90. At the same time, structural demand should continue keeping the metal comfortably supported above $70. Silver is therefore likely to remain trapped within a broad $70–$90 range over the coming weeks.
Technically, a firm break above 78.87 minor resistance would suggest Silver has already started another upleg within the broader range structure and reopen the path toward 89.37 resistance next.