

- Pandemic-induced high inflation exacerbated the 30-year-long phenomenon of increasing synchronisation, challenging consumers and investors alike.
- Economy-specific idiosyncrasies will both herald the end of high inflation synchronisation and result in novel tactical investment opportunities.
- Inflation trends tend to be shared globally over the long term, and global inflation‑sensitive strategies can be used regardless of investor location.
Understanding the drivers of domestic and global inflation is paramount for an investor to be successful in the current environment. Over the past several decades, inflation correlations across the globe increased as globalisation expanded its reach. In recent years, the correlation between US inflation and global inflation reached historically extreme levels after the Covid shock. In the short term, however, we expect inflation dynamics to differ, offering tactical opportunities to distinguish regional exposures. In this paper, we investigate different ways of quantifying the synchronisation trends of global inflation, offer some potential reasons behind why these trends have emerged, and discuss investment opportunities in the face of elevated inflation levels.
Is Inflation Synchronisation an Increasing Trend or Part of the Cycle?
We begin our investigation into global inflation synchronisation by quantitatively examining common inflation drivers and trends across countries.
The common drivers of global inflation have followed a cyclical pattern (Figure 1).1 We focus on a five decade sample of consumer price index (CPI) inflation rates for the United States, the United Kingdom, Australia, Canada, Germany, and Japan (G-6), which altogether account for 71% of the advanced economies' gross domestic product (GDP) and 41% of global GDP.2 Significant moves higher in the explanatory power of the first principal component follow large common inflation shocks in the 1970s (commodities) and in the 2020s (pandemic-related supply chain disruptions and the expansionary policy response). On average, the common inflation factor produced using principal component analysis (PCA) explains nearly 60% of the variance in G-6 inflation. When large-scale common inflation shocks have occurred in the past, this proportion has reached almost 80%.
Common Component of Global Inflation in G-6 Economies
(Fig. 1) First principal component from G-6 CPI inflation

Note: Using year-on-year percentage change in headline inflation from the G-6 from December 1965 to January 2023, we calculate the proportion of variance explained by the first principal component in a 10-year rolling window over all countries available for an entire 10-year time horizon. Shaded areas are NBER recessions. Sources: CPI inflation from U.S. Bureau of Labor Statistics, Statistics Canada, Statistisches Bundesamt, UK Office for National Statistics, Australian Bureau of Statistics, Japan Statistics Bureau, Haver Analytics; analysis by T. Rowe Price.
A similar cyclical pattern is evident when looking at the correlation of US inflation and other developed economies' inflation. The five-year average rolling correlation of US CPI inflation with that of the UK, Australia, Canada, Germany, and Japan oscillated and substantially increased in response to common shocks. However, greater harmony in global inflation is more than just a product of commodity shocks.3 Since the mid-1990s, the trend in the five‑year rolling average correlation of CPI inflation in global economies to the US has steadily increased (Figure 2).
Consumer Price Index Inflation Correlations
(Fig. 2) 5-year rolling average correlation of CPI inflation
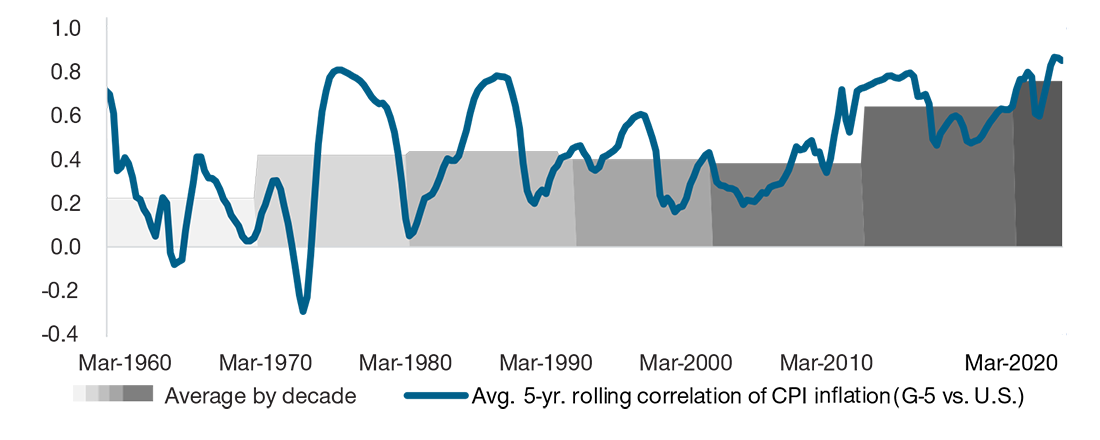
As of March 2023. Source: Haver Analytics. CPI year-on-year percentage change; WTI Cushing (average, in U.S. dollars per barrel) year-on-year percentage change. Oil shock included if year-on-year change was greater than 30%. Correlation of U.S. CPI inflation with that of the UK, Australia, Canada, Germany, and Japan. Graph shows average over countries. Analysis by T. Rowe Price.
This post was funded by T. Rowe Price
Important Information
For professional clients only. Not for further distribution.
This material is being furnished for general informational purposes only. The material does not constitute or undertake to give advice of any nature, including fiduciary investment advice, and prospective investors are recommended to seek independent legal, financial and tax advice before making any investment decision. T. Rowe Price group of companies including T. Rowe Price Associates, Inc. and/or its affiliates receive revenue from T. Rowe Price investment products and services. Past performance is not a reliable indicator of future performance. The value of an investment and any income from it can go down as well as up. Investors may get back less than the amount invested.
The material does not constitute a distribution, an offer, an invitation, a personal or general recommendation or solicitation to sell or buy any securities in any jurisdiction or to conduct any particular investment activity. The material has not been reviewed by any regulatory authority in any jurisdiction.
Information and opinions presented have been obtained or derived from sources believed to be reliable and current; however, we cannot guarantee the sources' accuracy or completeness. There is no guarantee that any forecasts made will come to pass. The views contained herein are as of the date noted on the material and are subject to change without notice; these views may differ from those of other T. Rowe Price group companies and/or associates. Under no circumstances should the material, in whole or in part, be copied or redistributed without consent from T. Rowe Price.
The material is not intended for use by persons in jurisdictions which prohibit or restrict the distribution of the material and in certain countries the material is provided upon specific request.
It is not intended for distribution to retail investors in any jurisdiction.
This material is issued and approved by T. Rowe Price International Ltd, 60 Queen Victoria Street, London, EC4N 4TZ which is authorised and regulated by the UK Financial Conduct Authority. For Professional Clients only.
© 2023 T. Rowe Price. All rights reserved. T. ROWE PRICE, INVEST WITH CONFIDENCE, and the bighorn sheep design are, collectively and/or apart, trademarks or registered trademarks of T. Rowe Price Group, Inc.