

Natural Gas Forecast – Talking Points
- Bullish EIA Short-Term Energy Outlook bolsters spot prices
- Strong liquified natural gas (LNG) exports expected to continue
- Price recaptures September trendline as technical posture improves
Natural gas prices are extending a move higher from earlier this week when the US Energy Information Administration’s (EIA) monthly Short-Term Energy Outlook bolstered its price forecast for the heating gas. Per the report, the average Henry Hub spot price for 2021 is $3.07/MMBtu, up from last month’s price of $3.05.
The EIA cites a modest decline in natural gas’s share of electricity power generation in the US, falling to account for 36% of total energy generated in 2021 from 39% in 2020. Due to this, US natural gas consumption is anticipated to fall 0.5% to 82.9 billion cubic feet per day (Bcf/d) in 2021 from last year. Coal is forecasted to soak up some of that output gap, due in part to higher prices.
Strong liquefied natural gas (LNG) exports are another driver behind the outlook from the EIA’s report. Indeed, LNG exports have been a strong tailwind for spot prices, with rising European and Asian demand supporting US outflows. In fact, exports are at a record high level following years of rising foreign demand for the heating product (See chart below).
Thursday will see the EIA’s Weekly Natural Gas Storage Report cross the wires, with analysts looking for a 99 billion cubic feet (Bcf) build in natural gas stocks for the week ended June 04. Inventory builds are typically seen during an injection season, where underground storage is increased during the off-season heating cycle. A weaker-than-expected rise in storage may help underpin prices in the short term.
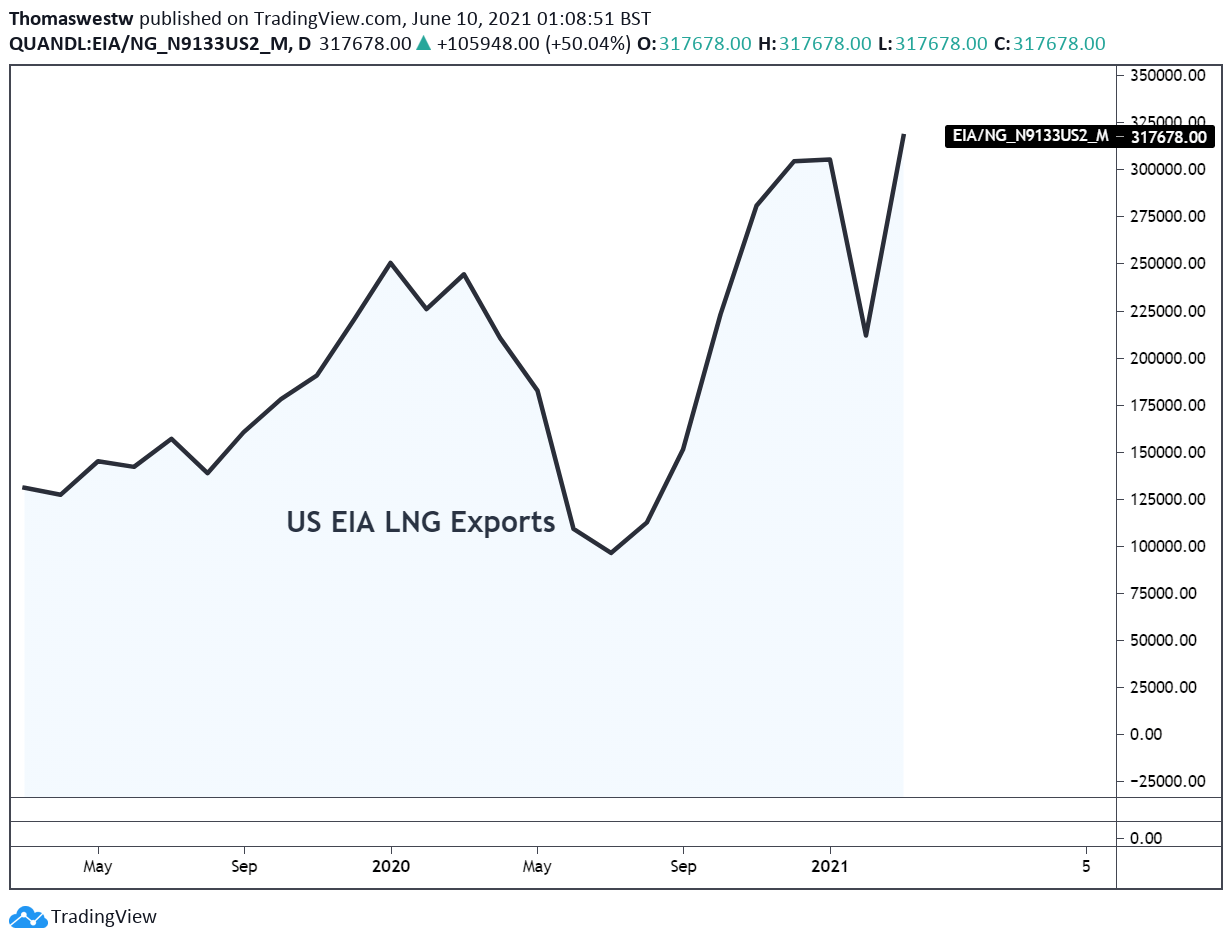
Chart created with TradingView
Natural Gas Technical Outlook
Natural gas price gains helped to recapture a trendline from the September swing low, which may act as support moving forward. The 2021 swing high at 3.316 will likely be a major test should prices continue to run higher. To the downside, the 20-day Simple Moving Average (SMA) is a possible area of support, with the rising 50- and 100-day SMAs below that.
While the upside appears to be the path of least resistance following the trendline recapture, negative divergences in the Relative Strength Index (RSI), as well as the MACD oscillator highlight possible weakening of momentum (highlighted in the chart below by the green lines). That said, breaking into a new yearly high will likely be a tall task even with the current strong technical posture.
Natural Gas Daily Chart
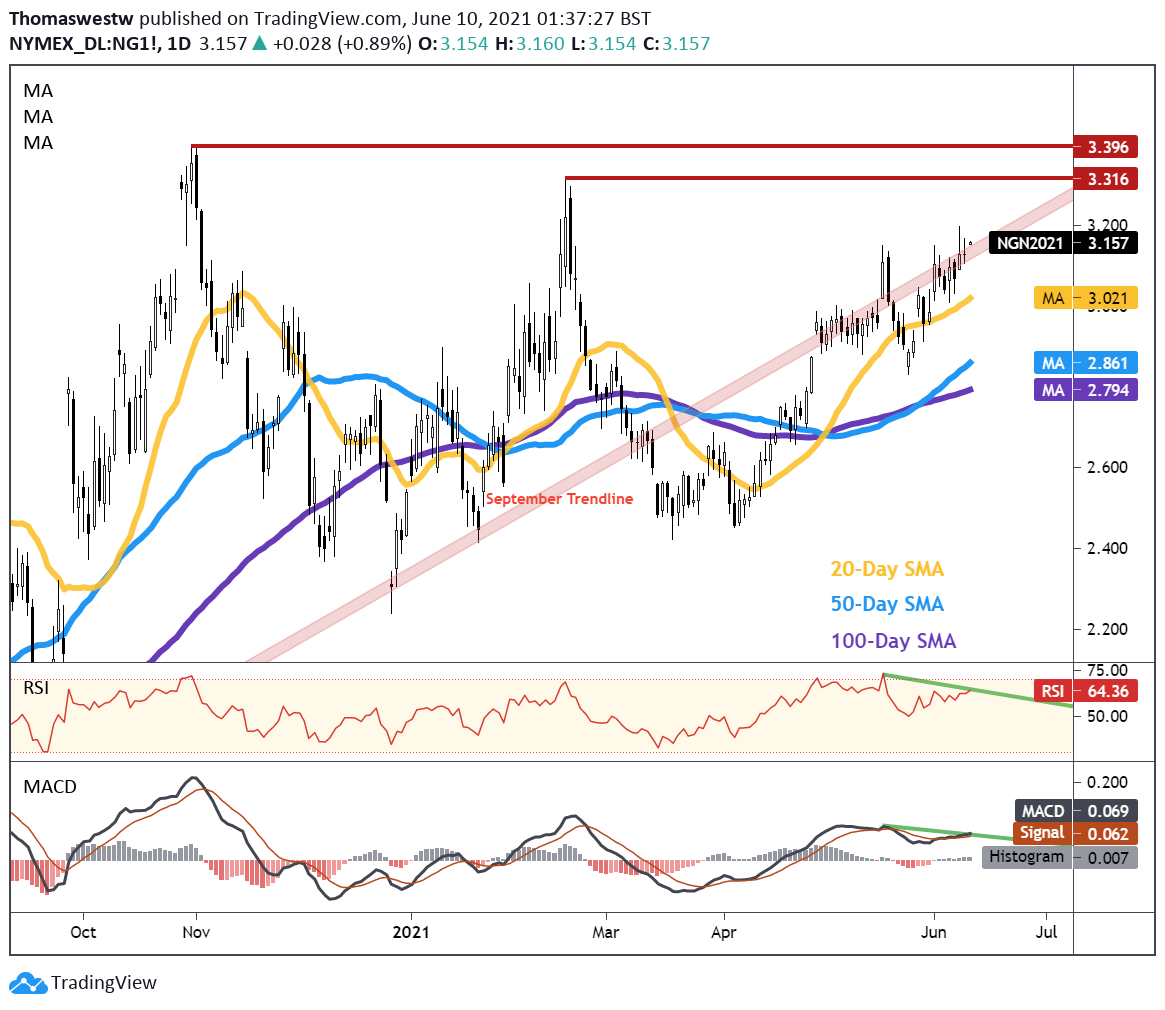
Chart created with TradingView
Natural Gas TRADING RESOURCES
- Just getting started? See our beginners’ guide for FX traders
- What is your trading personality? Take our quiz to find out
- Join a free webinarand have your trading questions answered
- Subscribe to the DailyFX Newsletter for weekly market updates
--- Written by Thomas Westwater, Analyst for DailyFX.com
To contact Thomas, use the comments section below or @FxWestwateron Twitter