

Gold and Silver rebounded notably today as oil prices extended their sharp decline and markets cautiously increased bets that at least a US-Iran ceasefire expansion/extension may be approaching.
US Secretary of State Marco Rubio acknowledged as much in New Delhi, saying there was a “pretty solid thing on the table” involving reopening the strait and entering “a very real, significant, time-limited negotiation on the nuclear matter.” Meanwhile, Donald Trump described during the weekend that the arrangement as a “Memorandum of Understanding pertaining to PEACE” that had been “largely negotiated.”
Meanwhile, it’s also reported that Iran had agreed “in principle” to reopen the Strait of Hormuz in exchange for the U.S. lifting its naval blockade and Tehran disposing of its highly enriched uranium. But the phrase “in principle” is doing enormous work right now. There is still no confirmation on what the actual agreement looks like, who controls transit through Hormuz, or whether enriched uranium disposal terms can realistically be finalized.
That combination of cautious optimism and lingering skepticism explains why precious metals are rebounding without fully breaking out. Markets are not yet pricing genuine normalization of global energy flows. Oil may be falling, but traders still want proof that Hormuz will truly reopen before aggressively unwinding geopolitical premiums across markets.
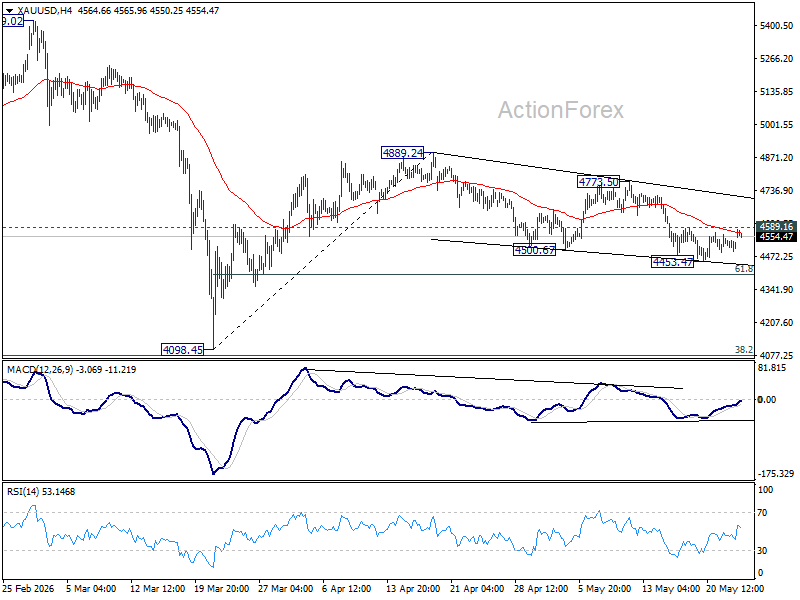
Technically, Gold’s fall from 4889.24 are seen as a corrective three-wave move. Firm break of 4589.16 resistance will argue that it has already completed at 4453.47. In this case, further rise should be seen to 4773.50 resistance to confirm this bullish case.
In case of another decline, strong support should be seen from 61.8% retracement of 4098.45 to 4889.24 at 4400.53 to contain downside.
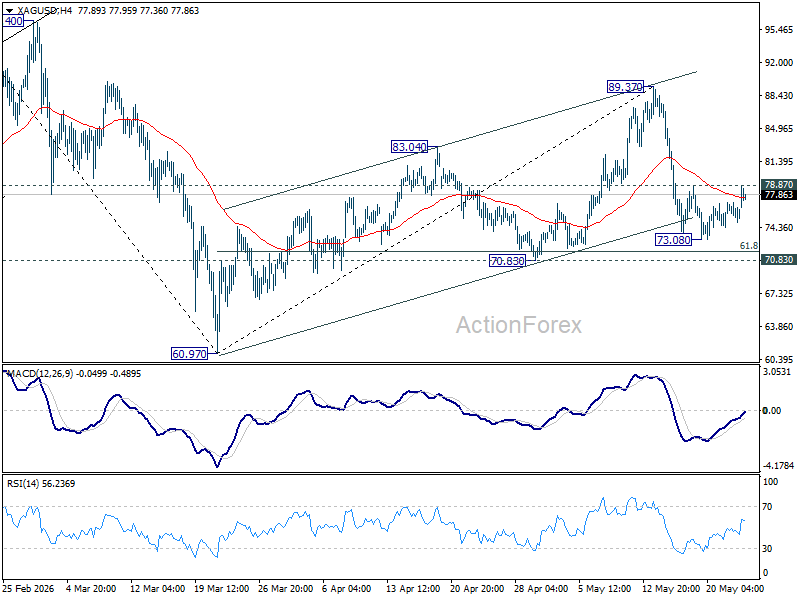
For Silver, break of 78.87 resistance will suggest that fall from 89.37 has completed at 73.08, ahead of 70.83 cluster support (61.8% retracement of 60.97 to 89.37 at 71.81). Rise from 73.08 would then be seen as the second leg of the sideway pattern from 89.37, and should target this resistance first.
Rejection of 78.87 might bring another fall, but mentioned 70.83/71.81 should hold to bring rebound.