
A fund manager, multi-asset manager, fund picker and economist each picked a graph to show the difficulties and benefits of investing in this asset class amid a new market cycle and shifting trends within this part of the market.
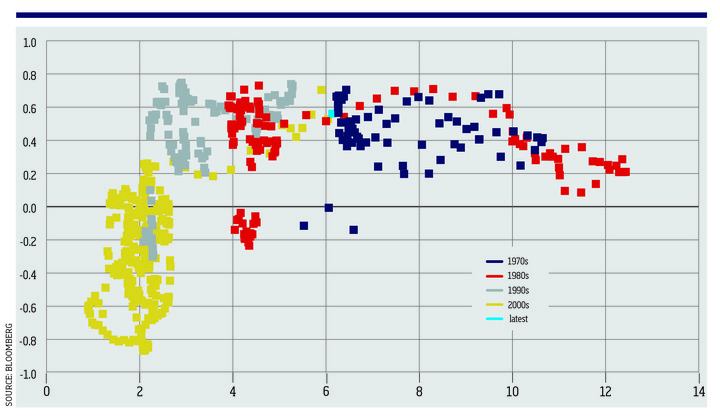
Equity/bond correlation (y axis) versus inflation (x axis)
Baylee Wakefield, multi-asset fund manager, Aviva
With central banks actively trying to create a growth slowdown, rather than reacting to one, the relationship between fixed income and risk assets has flipped. Over the last 20 years the growth cycle and growth-sensitive assets have driven rates; now rates are in the driving seat. There was a clear relationship between inflation and equity/bond correlations pre-2000, which seemed to invert over the last 20 years. This year we have moved back to the pre-2000s relationship of high inflation and a positive correlation, seeing both bonds and equities fall in price. Bonds have not provided protection, but this could change in 2023 as interest rates peak.