

Canadian Dollar Technical Analysis
- USD/CAD charts and analysis
- Canadian Dollar price action against US Dollar
Check our latest Q4 forecasts for free and learn what is likely to move the markets at this time of the year.
USD/CAD – Paused Uptrend Momentum
On Nov 20, USD/CAD rallied to 1.3327 – its highest level in six weeks. Later, the price slipped back then settled nearby 1.3300 handle. This week, the price has not been able to revisit the last week’s high, indicating that less buyers were joining the market.
The Relative Strength Index (RSI) remained flat above 50, indicating to a paused uptrend momentum.
Just getting started?See our Beginners’ Guide for FX traders
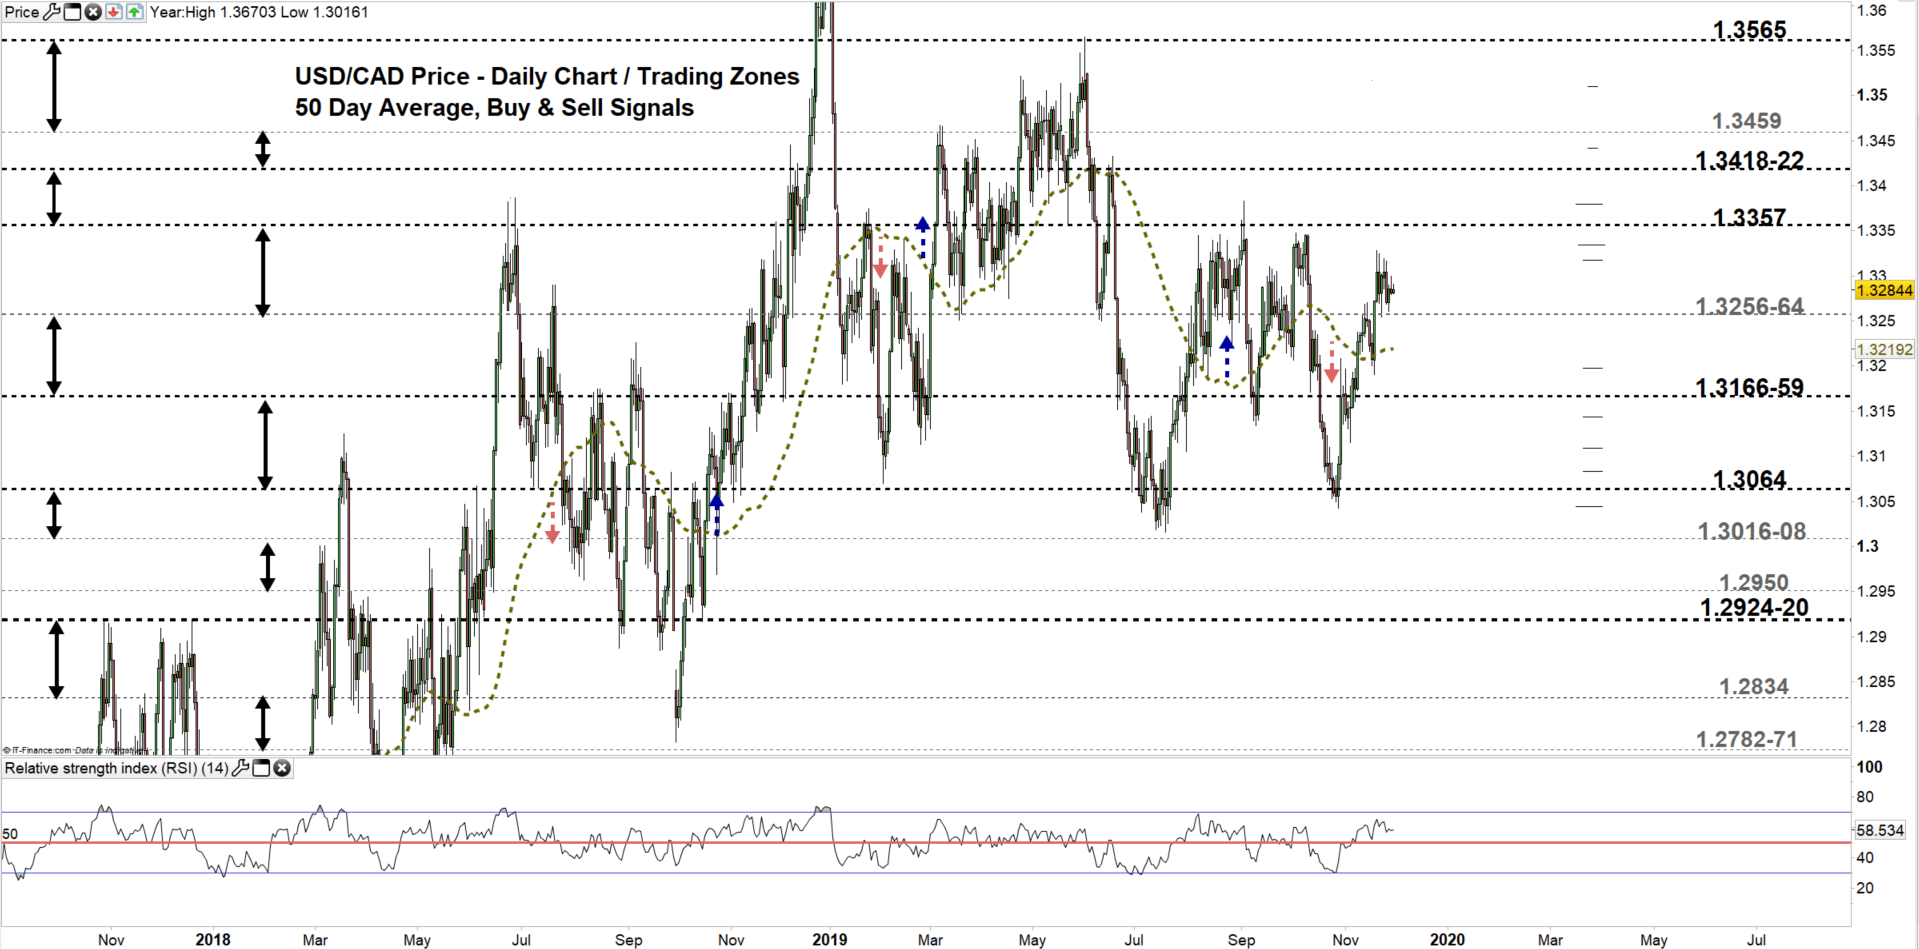
USD/CAD DAILY PRICE CHART (Sep 1, 2017 – Nov 29, 2019) Zoomed Out
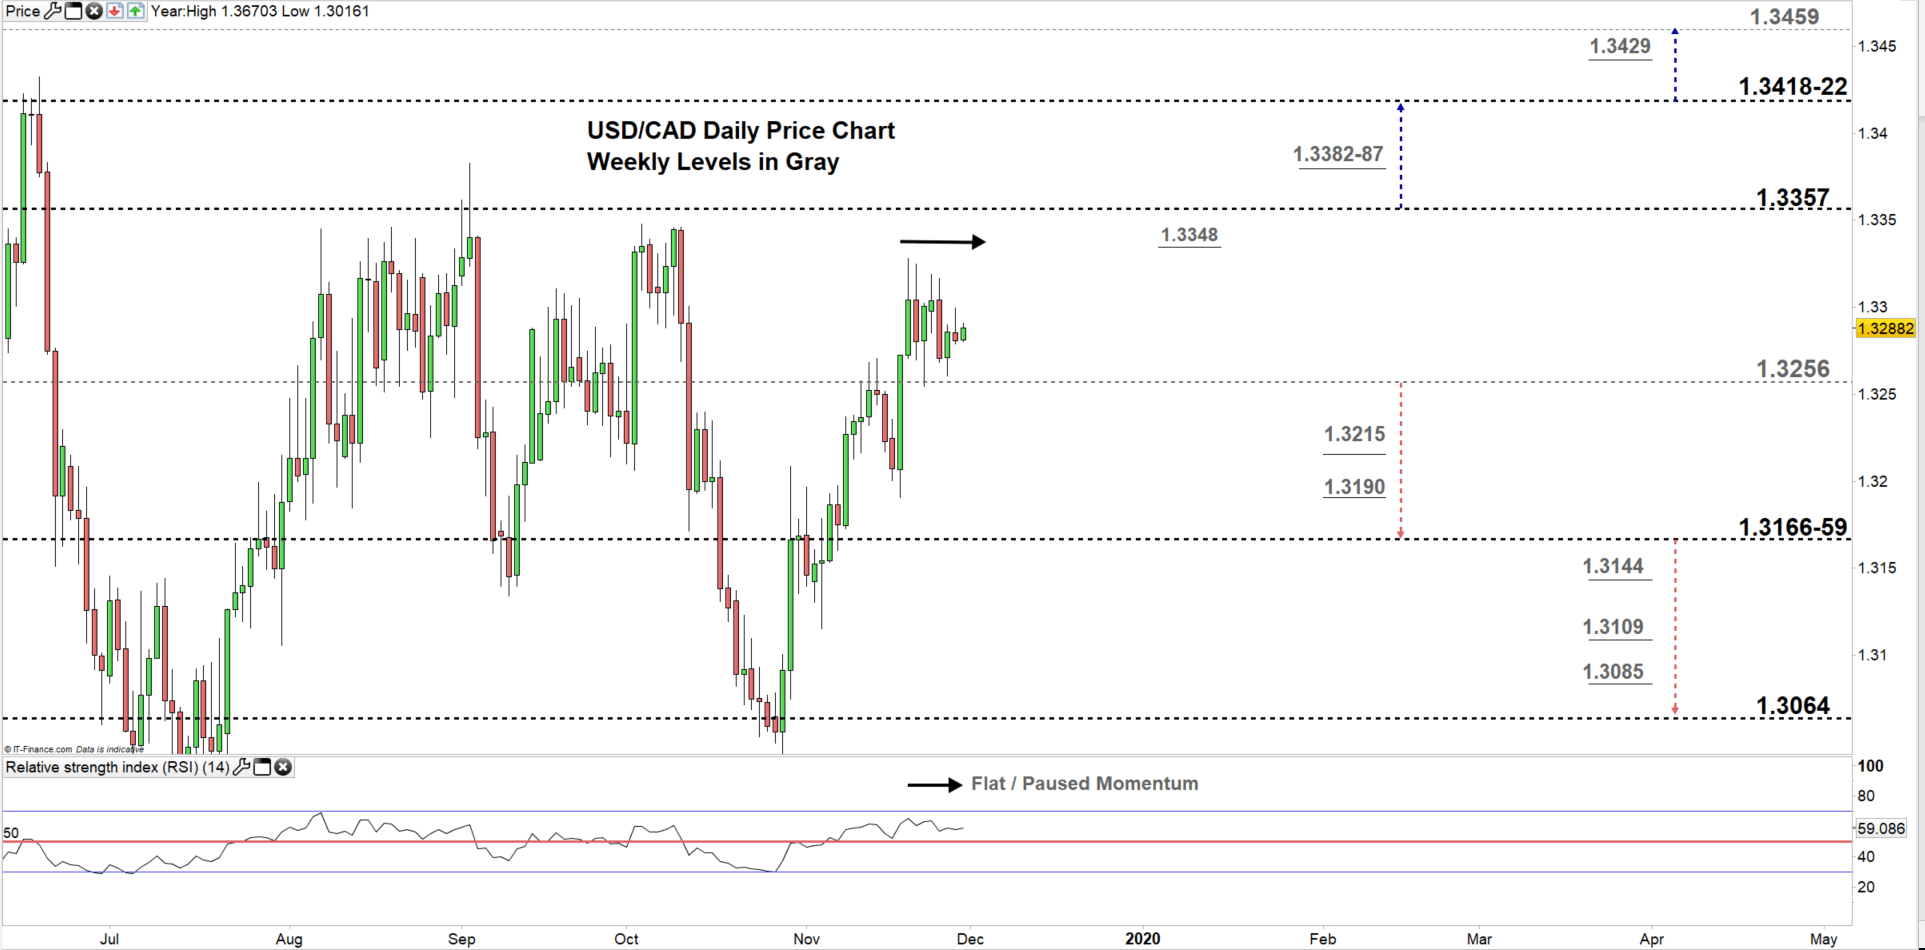
USD/CAD DAILY PRICE CHART (June 18– Nov 29, 2019) Zoomed In
From the daily chart, we notice on Nov 22 USD/CAD rebounded nearby the low end of current trading zone 1.3256 -1.3357. Highlighting, majority of buyers continued holding their positions. This caused the price to rally again eyeing a test of the high end of the zone.
Thus, a close above the high end of the zone could persuade more buyers to join the market and push towards the vicinity of 1.3418-22. In that scenario, the uptrend move could weaken at the weekly resistance levels underlined on the chart (zoomed in) as some buyers could take profit at these points.
In turn, a close below the low end of the zone could open the door for sellers to take the lead and press towards the vicinity of 1.3166-59. Nevertheless, some sellers may choose to exit the market at the weekly support levels underscored on the chart.
Having trouble with your trading strategy? Here’s the #1 Mistake That Traders Make
USD/CAD four hour PRICE CHART (Nov 6 – Nov 29, 2019)

Looking at the four- hour chart, we notice since Nov 20 USD/CAD's trading range has been narrowing. Currently, the pair develops a pennant pattern. This suggests the price would rally towards 1.3429 contingent on breaking and remaining above the upper line of the pennant.
Hence, a break above 1.3319 could push USDCAD towards the high end of trading zone discussed above on the daily chart. Although, the weekly resistance level marked on the chart should be considered. On the flip-side, a break below 1.3247 could send the price towards 1.3215. Yet, the support level at 1.3235 should be monitored.
See the chart to know more about key levels to monitor in a further bullish/bearish move.
Written By: Mahmoud Alkudsi
Please feel free to contact me on Twitter: @Malkudsi