

Canadian Dollar Forecast
- USD/CAD & EUR/CAD charts and analysis
- Canadian Dollar price action against US Dollar and Euro
Check our latest Q4 forecasts for free and learn what is likely to move the markets at this time of the year.
EUR/CAD, USD/CAD – Failing at 50- Day Moving Average
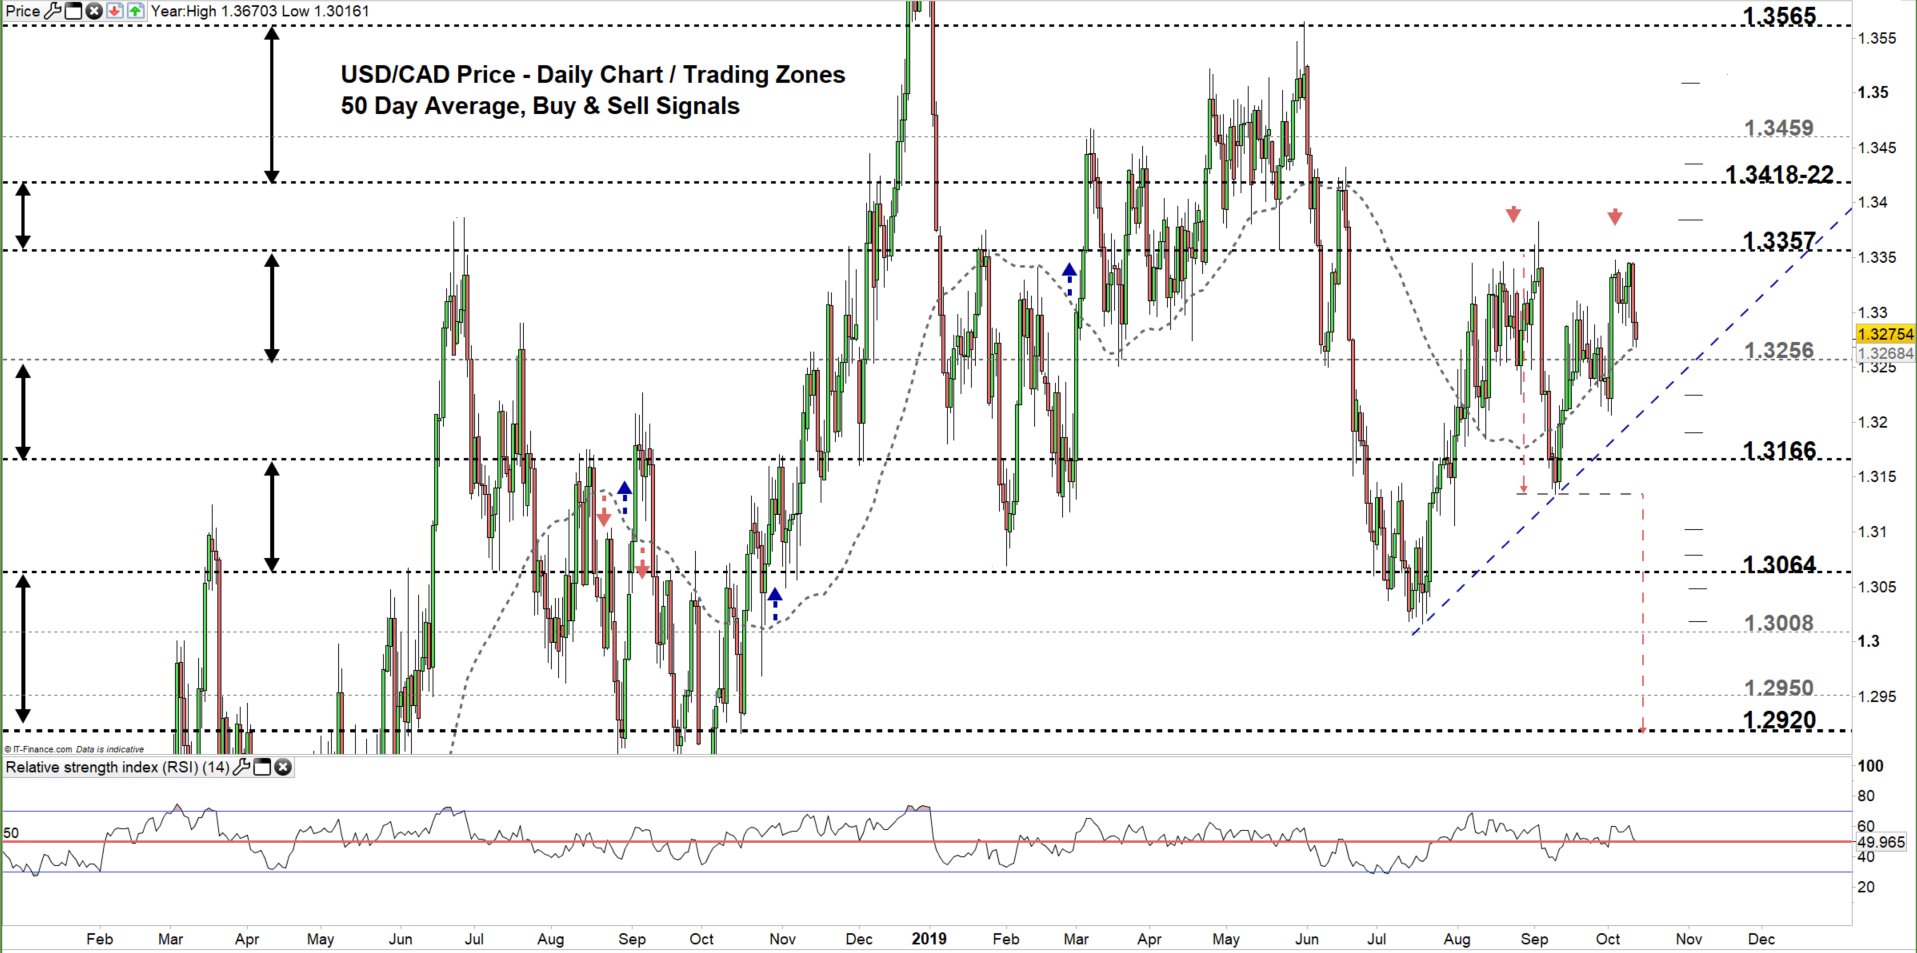
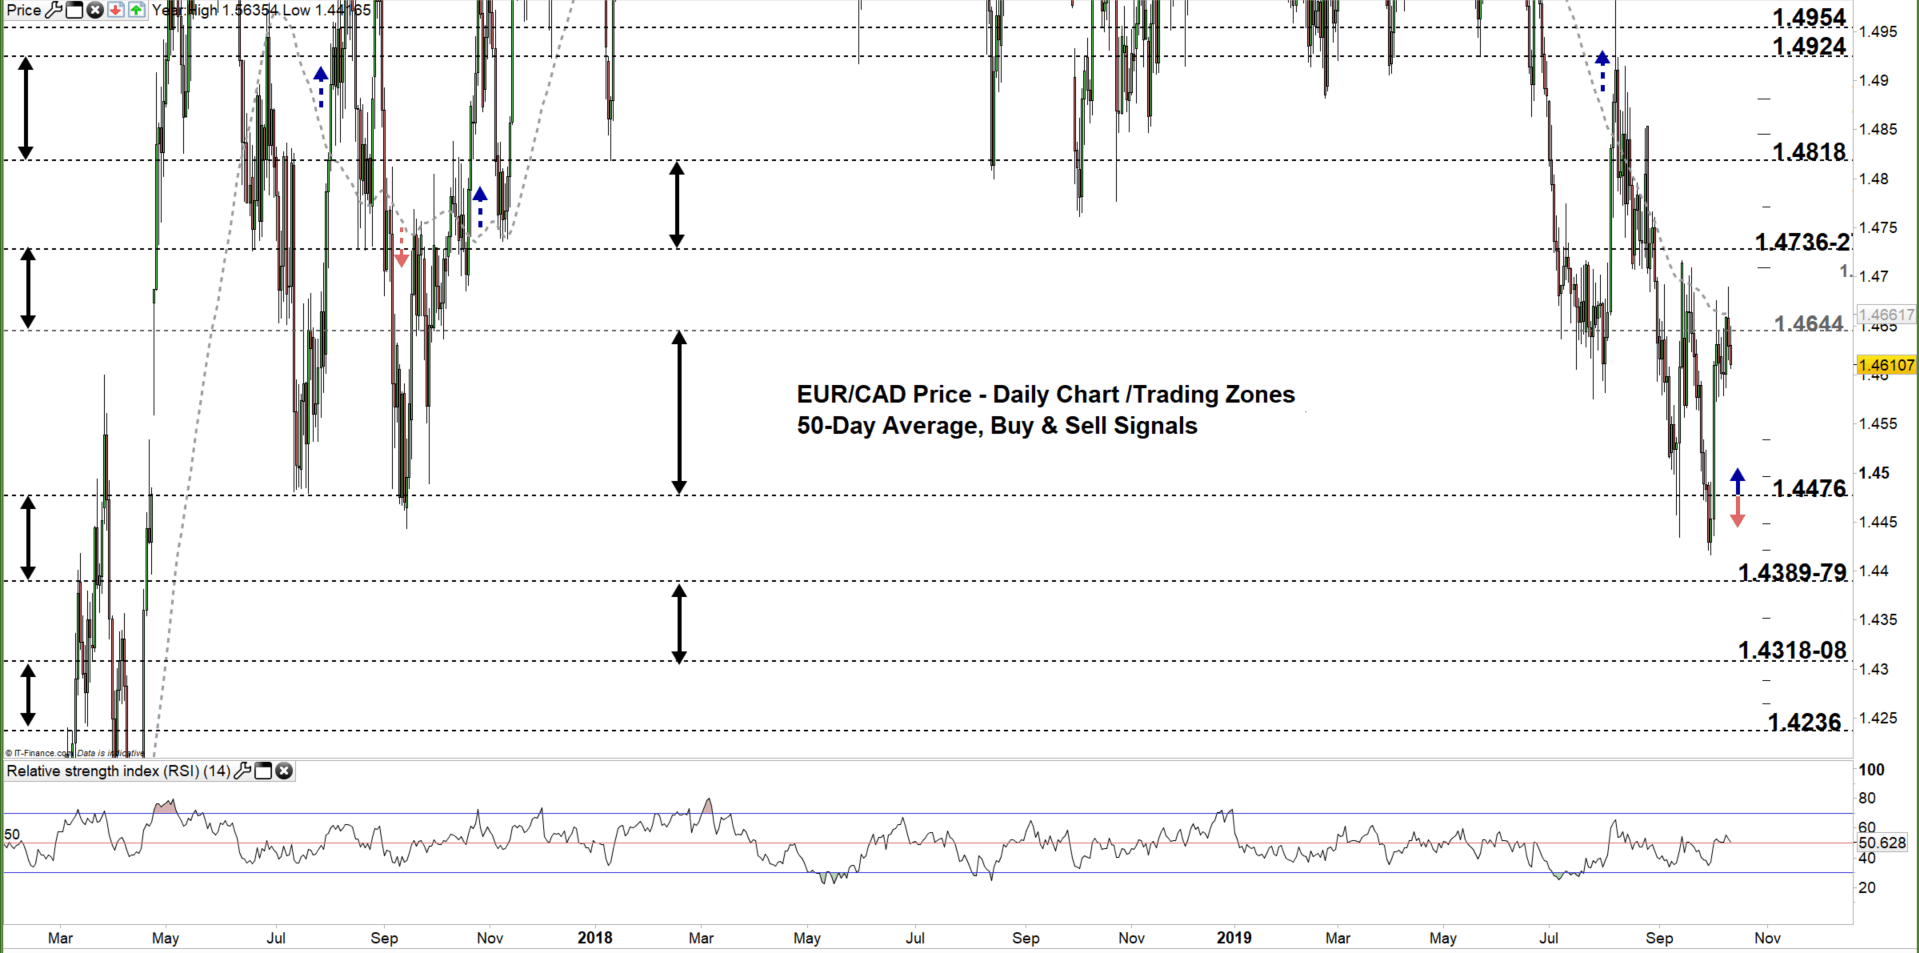
Yesterday, USD/CAD traded lower then rebounded from 50-day average at 1.3268. Today, the price has not been able to clear this level yet. On the other hand, EUR/CAD failed again to close above the 50-day average for the fifth time in a month showing weakness of uptrend momentum.
Alongside this, the Relative Strength Index (RSI) dropped nearing 50 level indicating that buyers were losing control.
Just getting started? See our Beginners’ Guide for FX traders
USD/CAD DAILY PRICE CHART (DEC 27, 2017 – OCT 11, 2019) Zoomed Out
USD/CAD DAILY PRICE CHART (JulY 12 – Oct 11, 2019) Zoomed In
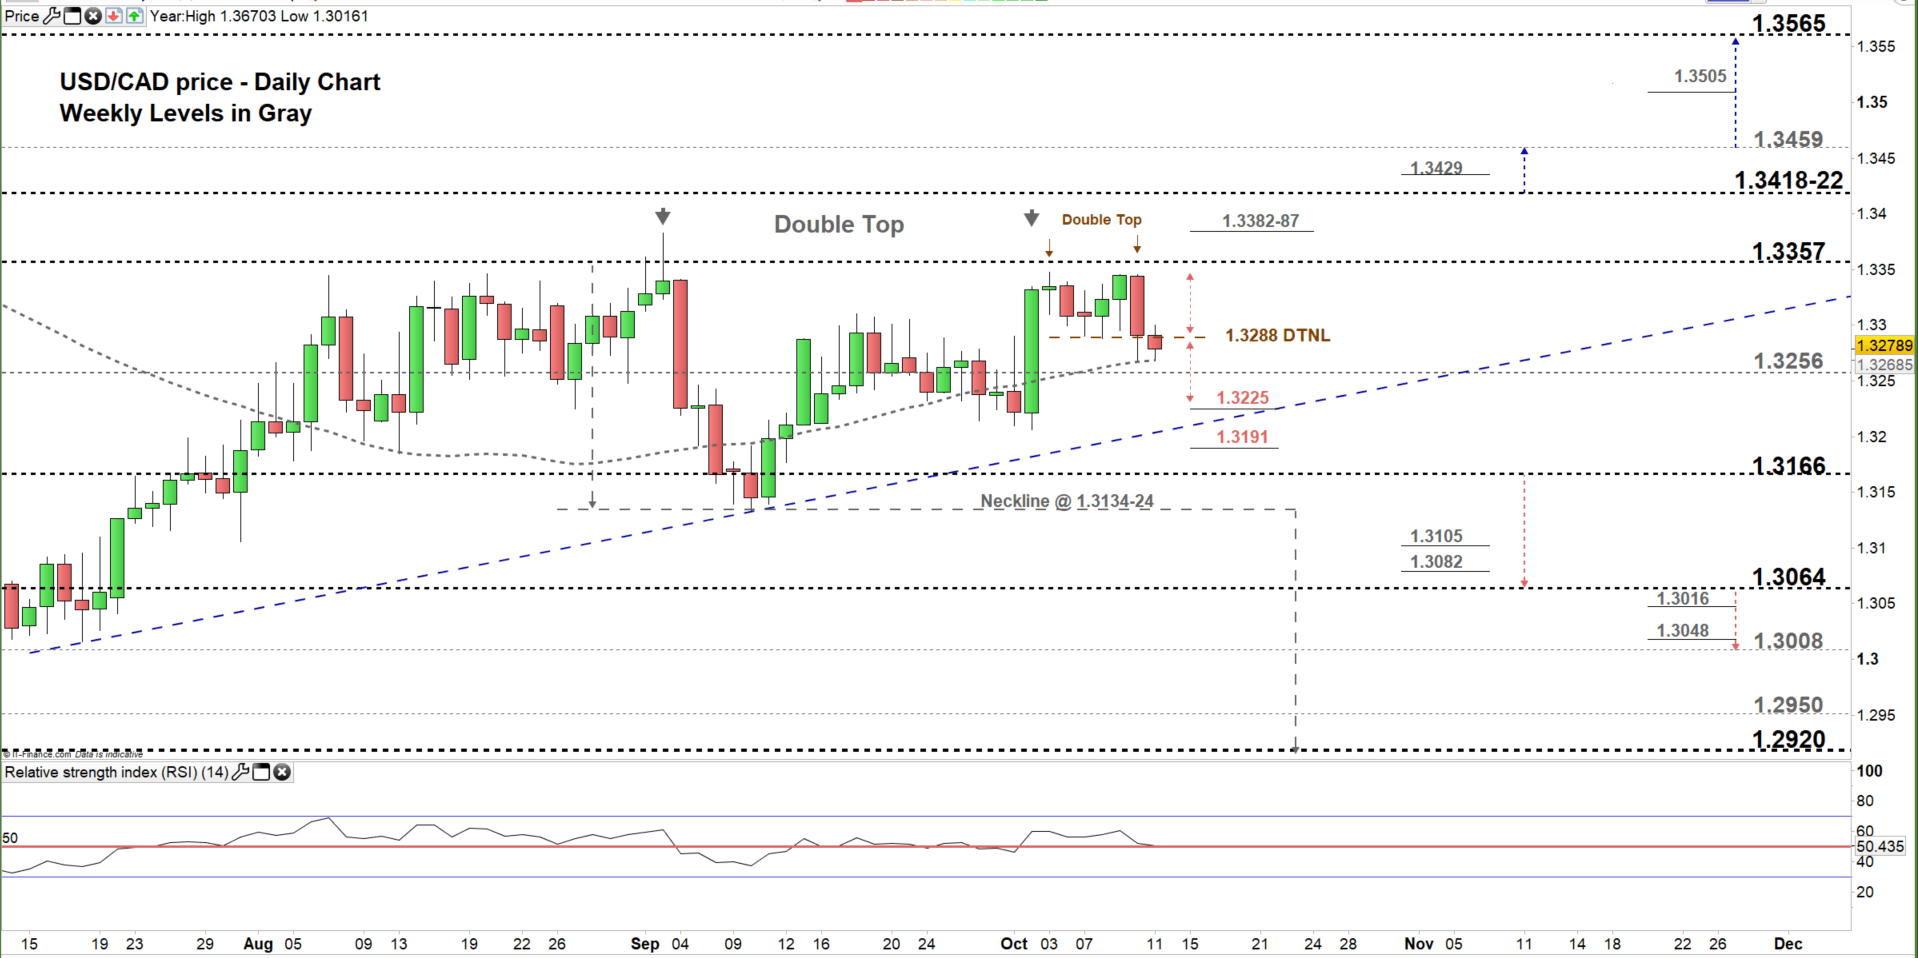
From the daily chart, we notice yesterday USD/CAD made a step towards the downside testing the neckline of small double top pattern located at 1.3288. Today, the pair has resumed its bearish move therefore, if it remains below the aforementioned neckline this suggests it could decline towards 1.3225.
In that scenario, a special attention needs to be paid at the closing price i.e. if USDCAD closes below 1.3256 it could press towards 1.3166. Although, the daily support underlined on the chart (Zoomed in) should be considered.
A closer look to the chart shows the existence of another double top pattern where the neckline residing at 1.3124. Hence, if USDCAD break and remains this level this could lead the price towards 1.2920. Nevertheless, the weekly support levels marked on the chart should be kept in focus.
Having said that, any close above 1.3357 may push USDCAD towards the vicinity of 1.3418-22. However, the weekly resistance area underscored on the chart should be monitored. See the chart to know more about higher trading zone/s with key levels to watch in a further bullish move.
Having trouble with your trading strategy? Here’s the #1 Mistake That Traders Make
EUR/CAD DAILY PRICE CHART (Jan 3, 2017– Oct 11, 2019) Zoomed Out
EUR/CAD DAILY PRICE CHART (AUG 12 – Oct 11, 2019) Zoomed In
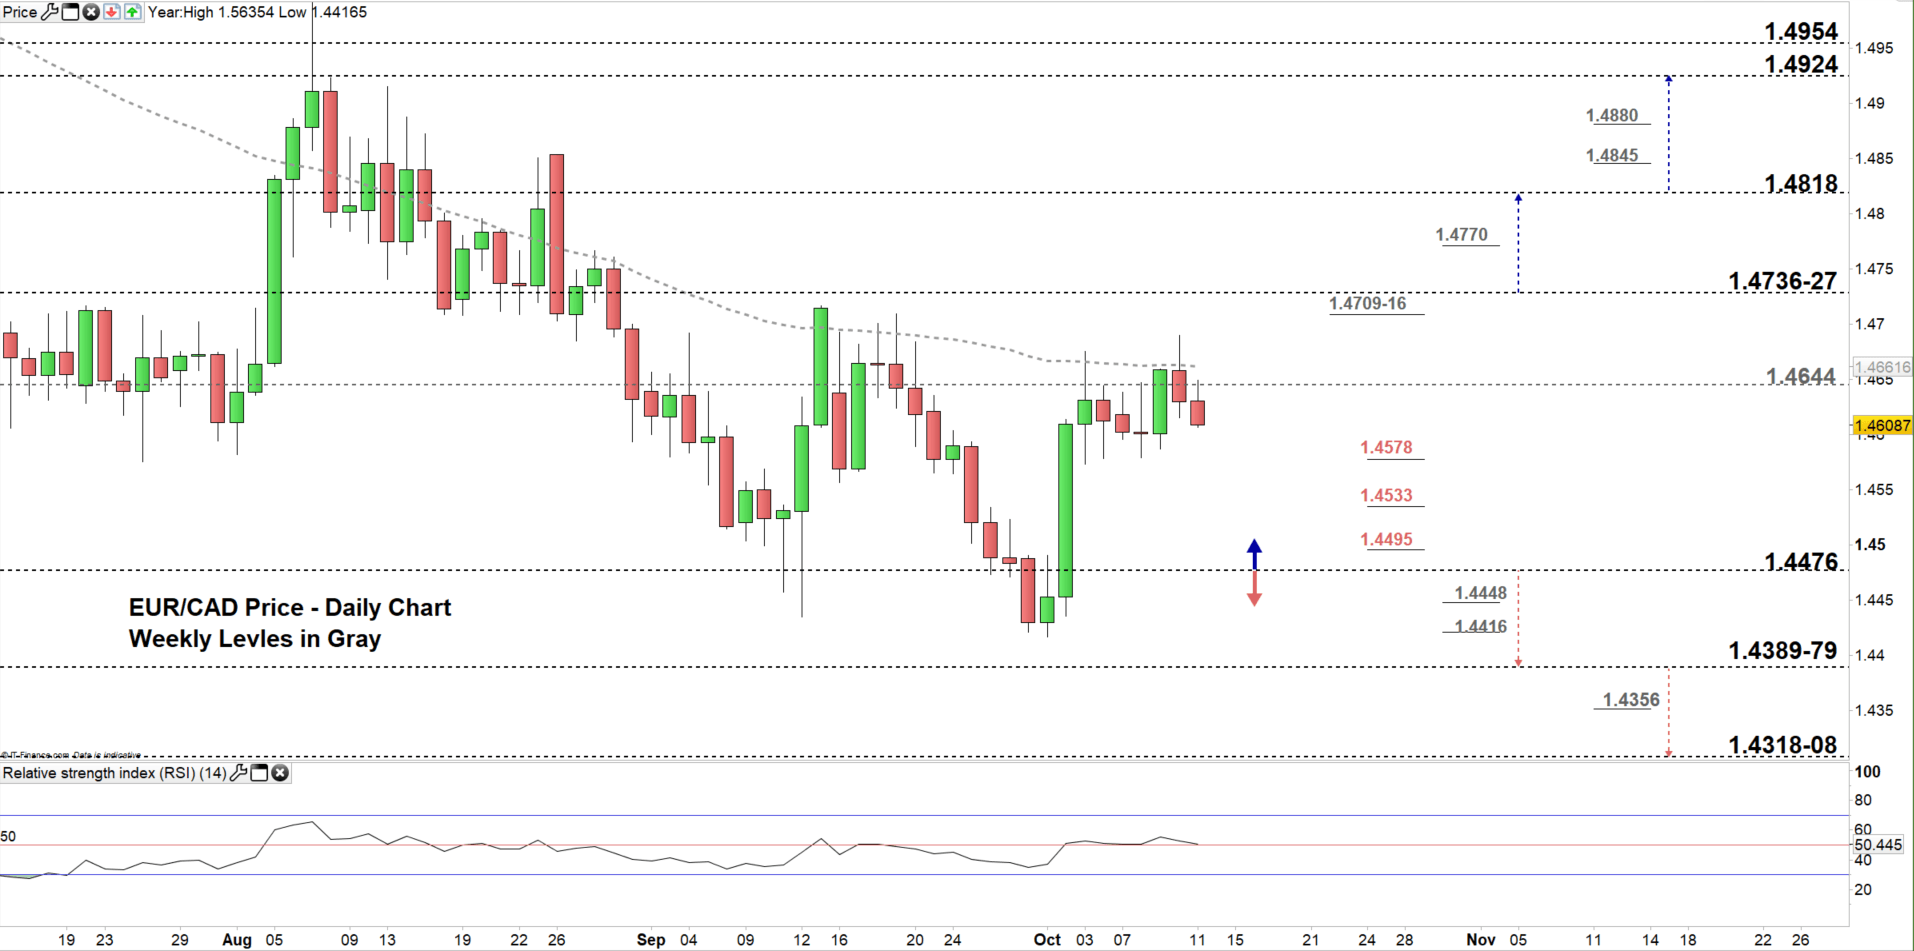
Looking at the daily chart, we notice yesterday EUR/CAD reverted back to the same old trading zone 1.4476 – 1.4644. A close below 1.4578 could press the pair towards the low end of the zone contingent on clearing the daily support levels underlined on the chart (Zoomed in).
It’s worth noting that, any close below the low end could send EURCAD towards the vicinity of 1.4389-79 taking into consideration the weekly levels marked on the chart. That said, a close above the low end could reverse the price’s direction leading EURCAD towards the high end of the zone.
Written By: Mahmoud Alkudsi
Please feel free to contact me on Twitter: @Malkudsi