
USD/CAD Dives 200 Pips In November, Will It Continue?

Previously, we wrote how USD/CAD appeared to be in a corrective phase higher within the context of a larger down trend. We estimated 1.27-1.31 as a potential pivot zone for the up move.
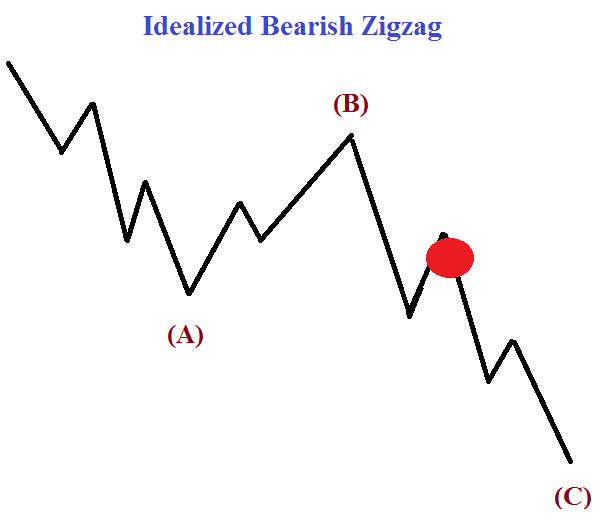
On October 31, USD/CAD reached a high of 1.2915 after completing a bullish zigzag pattern. As a result, USD/CAD has subsequently sold off over 200 pips. The Elliott Wave models we are following suggests additional rallies may be temporary and that the market is anticipated to be overly weak.
Why do a majority of traders lose? Find out in our traits of successful traders research.
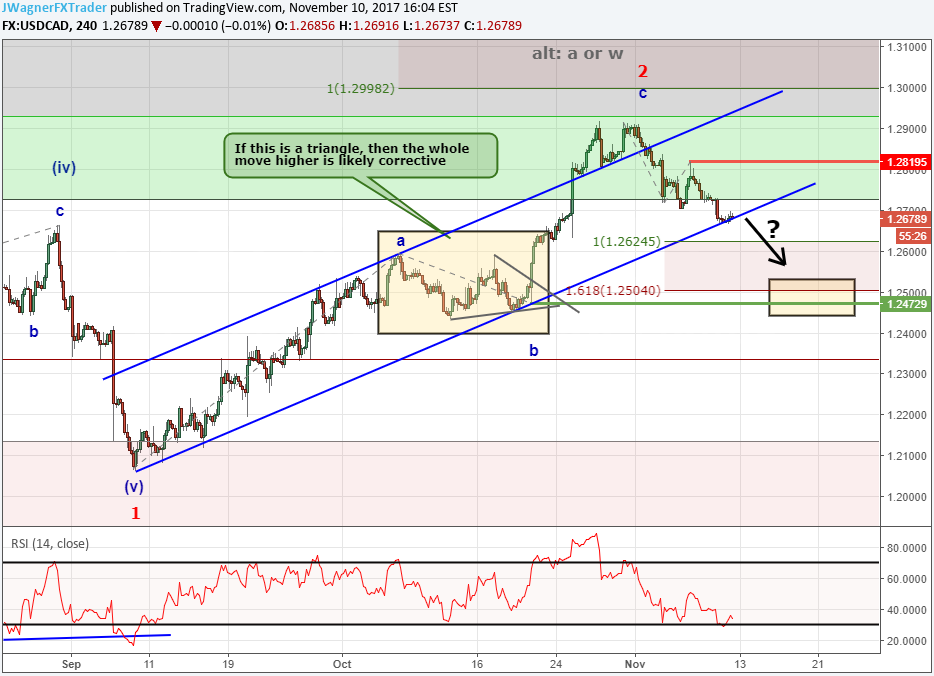
Currently, prices are resting on top of a support trend line. Though we may see a technical bounce higher, shorter-term traders may consider 1.2820 as the key level of resistance for an immediate bearish outlook.
The higher probability move at this point suggests USD/CAD may sell-off towards 1.2500 so long as prices are below 1.2820. Even lower prices are possible, but we will need to see the structure of the sell-off, if it occurs, to weigh the probabilities if this is the start of another long trend lower below 1.20.
From a sentiment perspective, the majority of traders are positioned net long and the number of long traders are growing. Sentiment is a contrarian tool so it provides us with a bearish signal for USD/CAD. As a result, the bearish sentiment signal on USD/CAD is lining up with our Elliott Wave forecast.
Whether we are still in a 2nd wave advance or third wave sell-off, the models are pointing to a USD/CAD forecast below 1.25 so long as 1.2820 holds.
Want to learn more about Elliott Wave analysis? Grab the Beginner and Advanced Elliott Wave guides and keep them near your computer.
---Written by Jeremy Wagner, CEWA-M
Jeremy is a Certified Elliott Wave analyst with a Master’s designation. This report is intended to help break down the patterns according to Elliott Wave theory.
Discuss this market with Jeremy in Monday’s US Opening Bell webinar.
Follow on twitter @JWagnerFXTrader .
Join Jeremy’s distribution list.
Other Elliott Wave forecasts by Jeremy:
Short term EURUSD Pattern Hints at Bounce to 1.17.
Gold price forecast points towards lower levels.
Crude oil prices reach highest level since July 2015.
Excent Capital: Supporting The Growth Of LATAM Advisors
The wealth management industry in Latin America is expanding rapidly due to stronger economies and a growing number of... Read more
Parallel Banking: Stablecoins Are Now Global
Parallel Banking: How Stablecoins Are Building a New Global Payments SystemStablecoins—digital currencies pegged to tr... Read more
Industry Responses: Strategies For Overcoming Regulatory Challenges In US Bitcoin ETF Approval
The journey towards the approval of Bitcoin Exchange-Traded Funds (ETFs) in the United States has been fraught with regu... Read more
Navigating Market Volatility: Assessing The Impact Of A Strengthening Dollar On US Stocks
In recent months, US stock markets have experienced a notable rally, with indices reaching new highs. However, amidst th... Read more
Forex Today: BoE & ECB Seen Holding Rates Today - 05 February 2026
Policy Meetings Today at Bank of England and European Central Bank; Tech Stock Selloff Continues; Gold, Silver Consolida... Read more
Blockchain's Truth Machine: How Prediction Markets Are Redefining Global Forecasting - 04 February 2026
Discover how blockchain-based prediction markets like Polymarket are revolutionizing global forecasting with $44 billion... Read more