
USD/CAD Bullish Channel Defines Current Trend

USD/CAD Weekly Time Frame
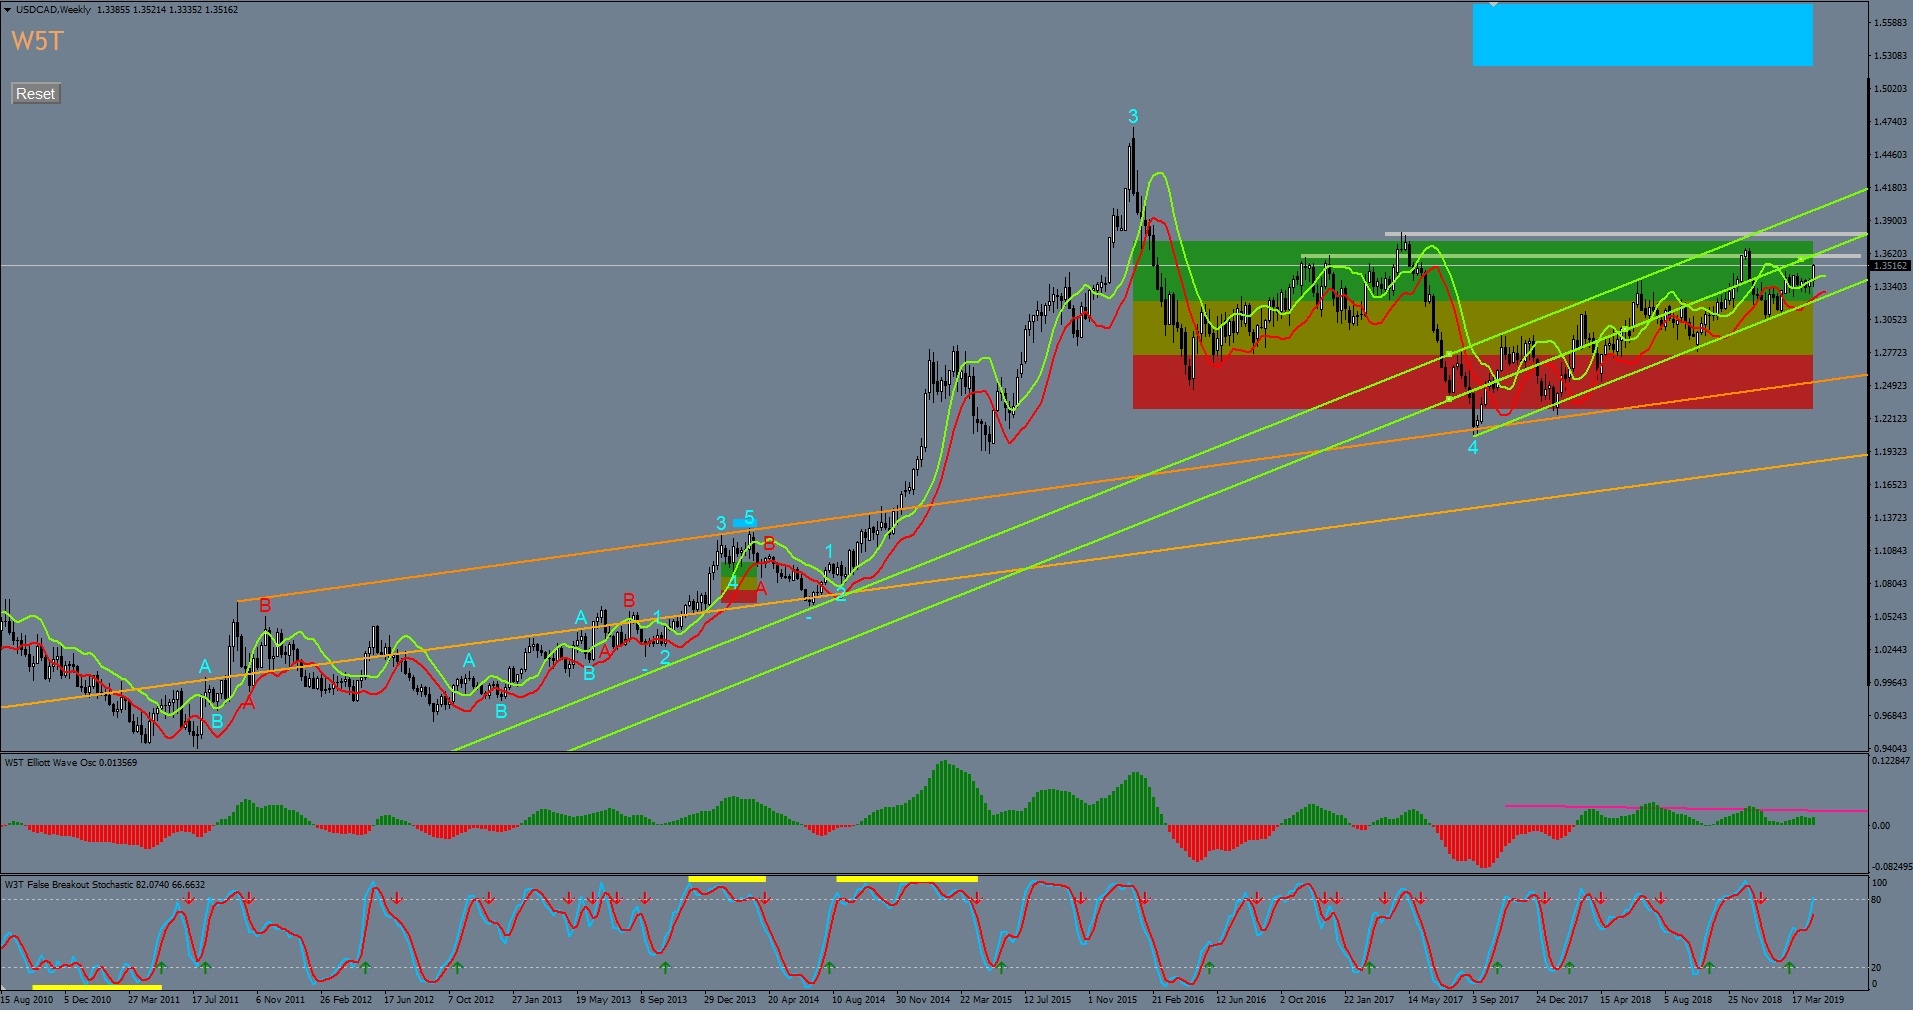
The Elliott Wave 4 pullback in USDCAD found support at the end of August 2017 that coincided with a longer-term trend line, in orange on the weekly chart below. This bearish pullback was indeed quite deep and tested the Red probability pullback zone offering a better risk to reward ratio (if support is held) of reaching the Elliott 5th Wave target in Blue around 1.5500.
This USDCAD currency pair has been in a bullish channel since the Wave 4 lows but is now approaching strong resistance around 1.3588 and then a little higher at 1.3790. These hurdles need to be crossed before the longer-term Bullish 5th wave move has real potential. On the positive side, this bullish trend channel, seen in green on the weekly chart below, has been respected very well for the past 19 months. Below this weekly chart lets discuss the daily chart.
USDCAD PRICE CHART: WEEKLY TIME FRAME (MAR 2011 – APR 2019)
USDCAD Daily Time Frame
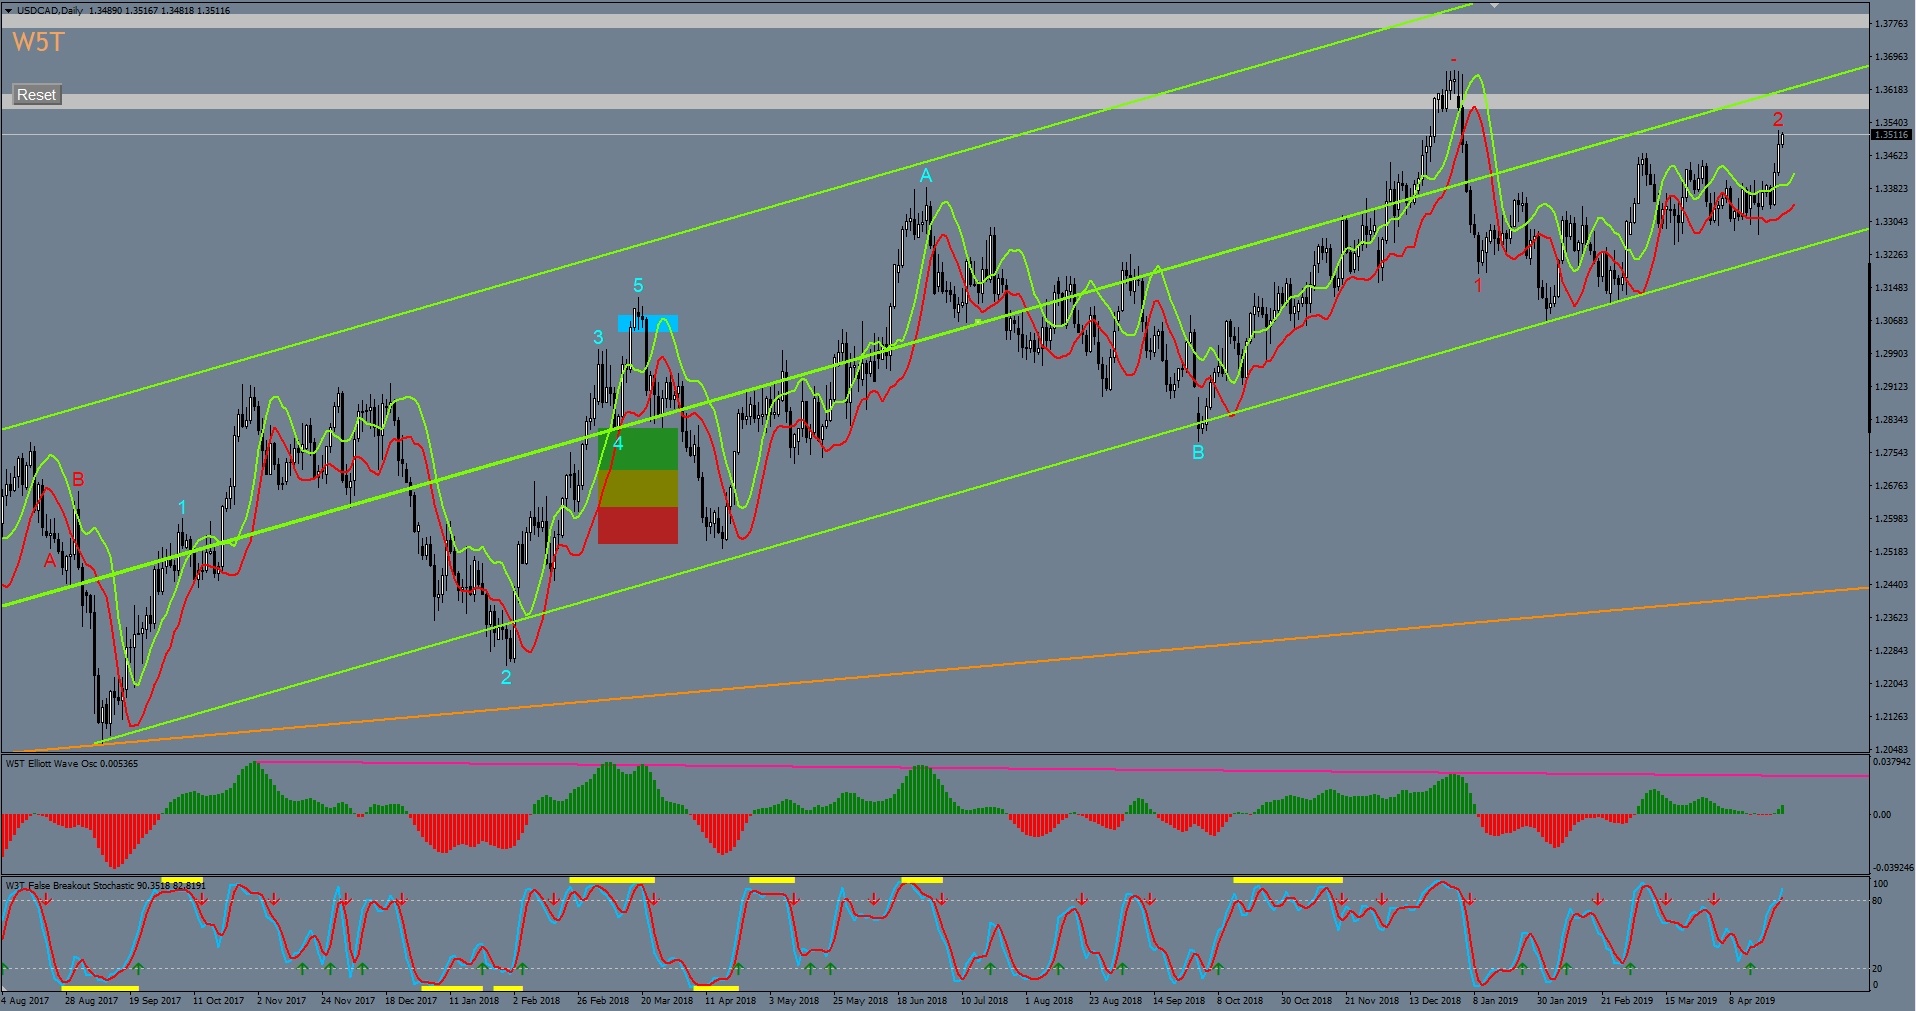
Using the daily time frame chart below to look a little closer look at this 19-month bullish channel. Although it is clearly a bullish trend, it has been a corrective bullish move with equal moves up and down with a bullish bias. This bullish bias can be seen over the last 12 months with the false breakout bars being present in the overbought zone of the stochastic on the chart below. Since the beginning of 2019 the stochastic has even failed to enter back into the oversold zone, with higher crossing points of the %K and %D lines, indicating strong bullish momentum.
Observations on the Elliott Wave Oscillator shows lower crowning on the green bullish moves, indicating oscillator divergence during this bullish channel move. This could indicate, the move is running out of momentum to the upside and together with these two linear resistance levels looming, a potential bearish ABC correction is a possibility.
A break of the Stochastic divergence could signal the start of the bearish correction. But if we gain another false breakout bar in the oversold zone and the Oscillator divergence is broken with a higher crowing. Then a breakout, up through resistance is a strong possibility.
A critical period over the next two weeks for this USDCAD currency pair with traders looking at both scenarios very closely. (Learn more about the MT4 Elliott Wave Indicator Suite.
USDCAD PRICE CHART: DAILY TIME FRAME (AUG 2017 – APR 2019)
You might be interested in...
Excent Capital: Supporting The Growth Of LATAM Advisors
The wealth management industry in Latin America is expanding rapidly due to stronger economies and a growing number of... Read more
Parallel Banking: Stablecoins Are Now Global
Parallel Banking: How Stablecoins Are Building a New Global Payments SystemStablecoins—digital currencies pegged to tr... Read more
Industry Responses: Strategies For Overcoming Regulatory Challenges In US Bitcoin ETF Approval
The journey towards the approval of Bitcoin Exchange-Traded Funds (ETFs) in the United States has been fraught with regu... Read more
Navigating Market Volatility: Assessing The Impact Of A Strengthening Dollar On US Stocks
In recent months, US stock markets have experienced a notable rally, with indices reaching new highs. However, amidst th... Read more
Forex Today: BoE & ECB Seen Holding Rates Today - 05 February 2026
Policy Meetings Today at Bank of England and European Central Bank; Tech Stock Selloff Continues; Gold, Silver Consolida... Read more
Blockchain's Truth Machine: How Prediction Markets Are Redefining Global Forecasting - 04 February 2026
Discover how blockchain-based prediction markets like Polymarket are revolutionizing global forecasting with $44 billion... Read more