

US DOLLAR WEEKLY TECHNICAL FORECAST – EUR/USD, GBP/USD, AUD/USD & USD/CAD IN FOCUS:
- USD price action has edged roughly 1.5% lower since touching year-to-date highs earlier this month and the recent stretch of weakness jeopardizes the US Dollar’s bullish trend
- The latest US Dollar Price Volatility Report details options-implied trading ranges for EUR/USD, GBP/USD, AUD/USD and USD/CAD for the week ahead
- For comprehensive fundamental and technical insight on the US Dollar, download our free 4Q-2019 Forecasts and Trading Guides
It is important to note that fundamental drivers frequently serve as catalysts that spark major shifts in trends or breakouts from longstanding technical levels. That said, high-impact event risk (detailed on the DailyFX Economic Calendar) is plentiful next week for major US Dollar currency pairs and brings EUR/USD, GBP/USD, AUD/USD as well as USD/CAD price action into focus.
EUR/USD PRICE CHART: DAILY TIME FRAME (MAY 22, 2019 TO OCTOBER 11, 2019)
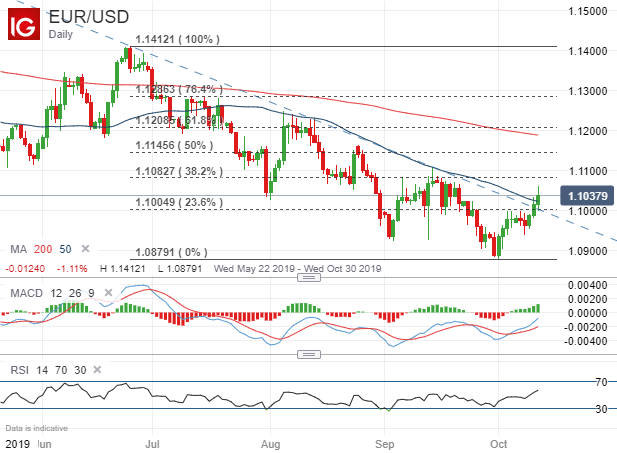
The recent rip higher in EUR/USD off its weakest level since May 2017 appears to have broken the bearish trendline extended from the June 25 and August 13 intraday swing highs. EUR/USD bulls can now look to the 38.2% Fibonacci level and mid-point retracement of the slow-and-steady churn lower in spot prices since late June as potential upside targets. The 50-day simple moving average and 23.6% Fib could serve as support going forward if EUR/USD attempts to pivot back lower.
GBP/USD PRICE CHART: WEEKLY TIME FRAME (DECEMBER 24, 2017 TO OCTOBER 11, 2019)
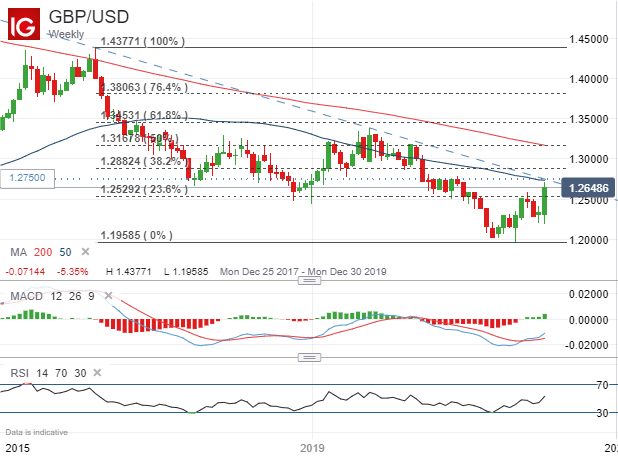
A weekly GBP/USD chart brings to focus the prevailing downtrend etched out by the cable, which is underpinned by the lower highs printed in April 2018 and March 2019. GBP/USD price action is threatening a breakout above this bearish trendline, however, as Brexit deal hopes rise. Moves to the upside have gained pace recently evidenced by the MACD while the recent rebound in spot prices has bolstered the RSI well out of “oversold territory.”
Yet the 50-SMA could cause GBP/USD to gravitate back lower toward the 23.6% Fibonacci retracement of its trading range since 2018. Also, there is a possibility that year-to-date lows might targeted again if the threat of no-deal Brexit happens to reemerge ahead of the current October 31 deadline. Nevertheless, topping the confluent resistance zone around the 1.2750 mark opens up the door to test the 38.2% Fib near the 1.2900 handle before year-to-date highs come into focus.
AUD/USD PRICE CHART: DAILY TIME FRAME (JUNE 27, 2019 TO OCTOBER 11, 2019)
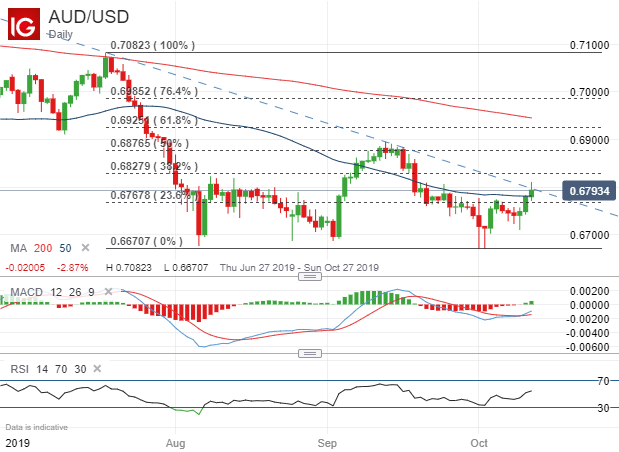
AUD/USD briefly eclipsed its downward sloping trendline after jumping above its 50-day SMA early during Friday’s trading session. I noted earlier that the Australian Dollar hinged on US-China trade talks and progress made by the US and China this week toward reaching a trade deal (deemed a phase 1 trade agreement by Trump) helped bolster spot AUD/USD.
The MACD indicator reveals positive divergence as upward momentum builds, which has also driven the RSI comfortably above 50. The latest stretch of gains in spot AUD/USD prices could begin to run out of steam, however, as major confluence around the 0.6800 handle might keep further advances at bay. That said, lingering risk appetite could help propel AUD/USD higher toward technical resistance posed by the 38.2% Fib and mid-point retracement levels of the currency pair’s bearish leg etched out since July.
USD/CAD PRICE CHART: DAILY TIME FRAME (APRIL 09, 2019 TO OCTOBER 11, 2019)
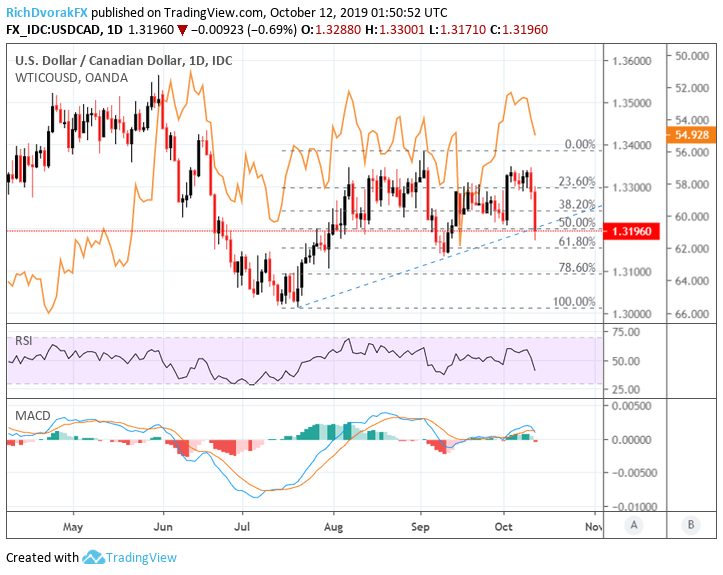
Chart created by @RichDvorakFX with TradingView
Last but not least, USD/CAD comes into focus following another robust Canada jobs report with attention now shifting to Canadian inflation and US retail sales data on deck next week. Spot USD/CAD prices threaten to continue drop seeing that the currency pair plunged beneath its uptrend line extended from the higher monthly lows printed back in July and August.
This area is also highlighted by the mid-point retracement of USD/CAD’s recent bullish leg. With crude oil price outlook becoming more optimistic, the US Dollar could fall further relative to its Canadian counterpart given the generally inverse relationship between oil prices and USD/CAD, which is illustrated above.
Also, the RSI and MACD suggest that selling pressure in spot USD/CAD is picking up and could drive prices toward the 61.8% Fib and September lows. Though spot prices did recover some downside before Friday’s close and is currently treading water around confluence at the 1.3200 handle. For more details on USD/CAD, check out this Canadian Dollar Forecast.
-- Written by Rich Dvorak, Junior Analyst for DailyFX.com
Connect with @RichDvorakFX on Twitter for real-time market insight