

US Dollar, Japanese Yen, Technical Analysis – Talking Points
- Using currency indexes can help you define average dominant trends
- The US Dollar and Japanese Yen appear to have seen false breakouts
- Will their dominant downtrends resume versus EUR, GBP and AUD?
Majors-Based US Dollar Index
The haven-linked US Dollar and anti-risk Japanese Yen appear to have experienced false upside breakouts, reinstating the focus on their downtrends. Below is a daily chart of a majors-based US Dollar index where its value is derived against an average of the Euro, Japanese Yen, British Pound and Australian Dollar. These are its most-liquid counterparts and analyzing this index may reveal the prevailing trend ahead.
This past week, the US Dollar lost its upside momentum in the aftermath of a Morning Star candlestick pattern. That is a bullish formation that can precede a reversal of trend. Prices then attempted to push above descending resistance from October, red-dashed line on the chart below. This ended up being a false breakout and resistance was established between 1.2888 and 1.2920.
On the whole, the US Dollar could be looking at making another attempt to resume its downtrend since September. If this index can push through support at 1.2691, that may pave the way for the greenback to weaken to levels not seen on average since April. Otherwise, clearing 1.2920 opens the door to revisiting highs from November.
Daily Chart
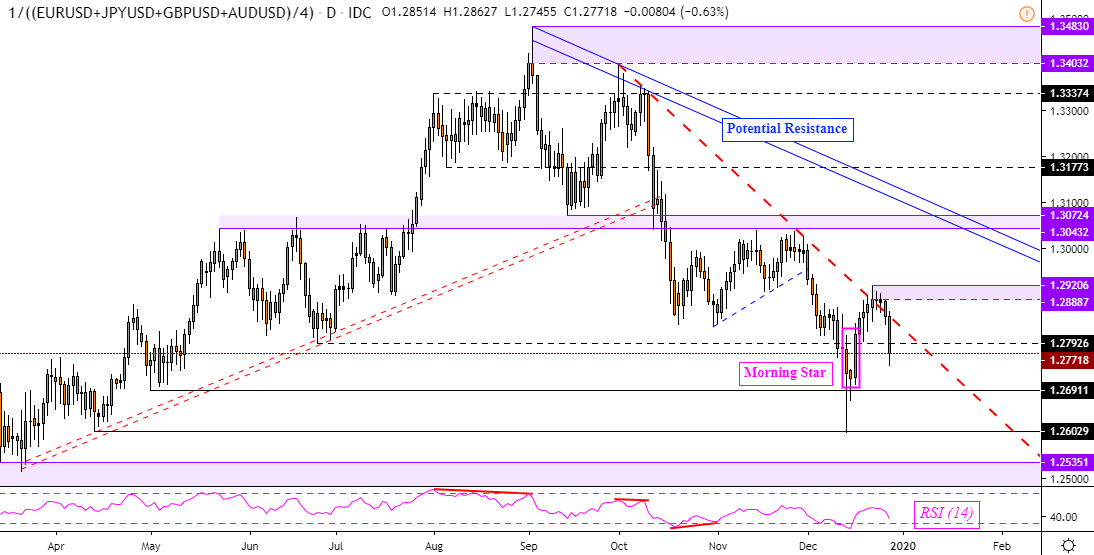
Chart Created Using TradingView
Majors-Based Japanese Yen Index
A similar story is unfolding in the Japanese Yen. Below is a majors-based JPY index where its value is composed of an average against the US Dollar, Australian Dollar, British Pound and Euro. Arguably the dominant uptrend still holds. Rising support from January 2018 is outlining a very steady and cautious path of appreciation in the long run.
The Yen also lost upside momentum following a false breakout through falling resistance from October, red-dashed line below. This has left behind key resistance at 0.0089, just above this lays what may be a potential falling trend line from September. That has left prices on average facing current December lows. While there may be room for further declines ahead, rising support could refocus the outlook towards the upside.
Daily Chart

Chart Created Using TradingView
--- Written by Daniel Dubrovsky, Currency Analyst for DailyFX.com
To contact Daniel, use the comments section below or @ddubrovskyFX on Twitter