
S&P 500 Peeks Below Trend Line Jeopardizing 10 Year Uptrend

Is the S&P 500 Up trend over?
S&P 500 cracked an important level today the jeopardizes the ten year up trend that began near 676 back in 2009. As a result, the probabilities are shifting that an important high is in place and a significant portion of this uptrend may be retraced.
From March 2009 to October 2018, S&P 500 increased about 335% making it a memorable bull run. That memory may soon begin to fade as S&P 500 cracked an important trend line.
For the past seven weeks we have been highlighting the significance for a large correction in S&P 500. At that time, we mentioned a break below 2550 cracks this Elliott wave trend line. From an Elliott wave perspective, the (2)-(4) Elliott wave channel trend line is a barometer for the health of the 10 year up trend. Today, S&P 500 has toyed with this line.
S&P 500 chart with Elliott wave labels
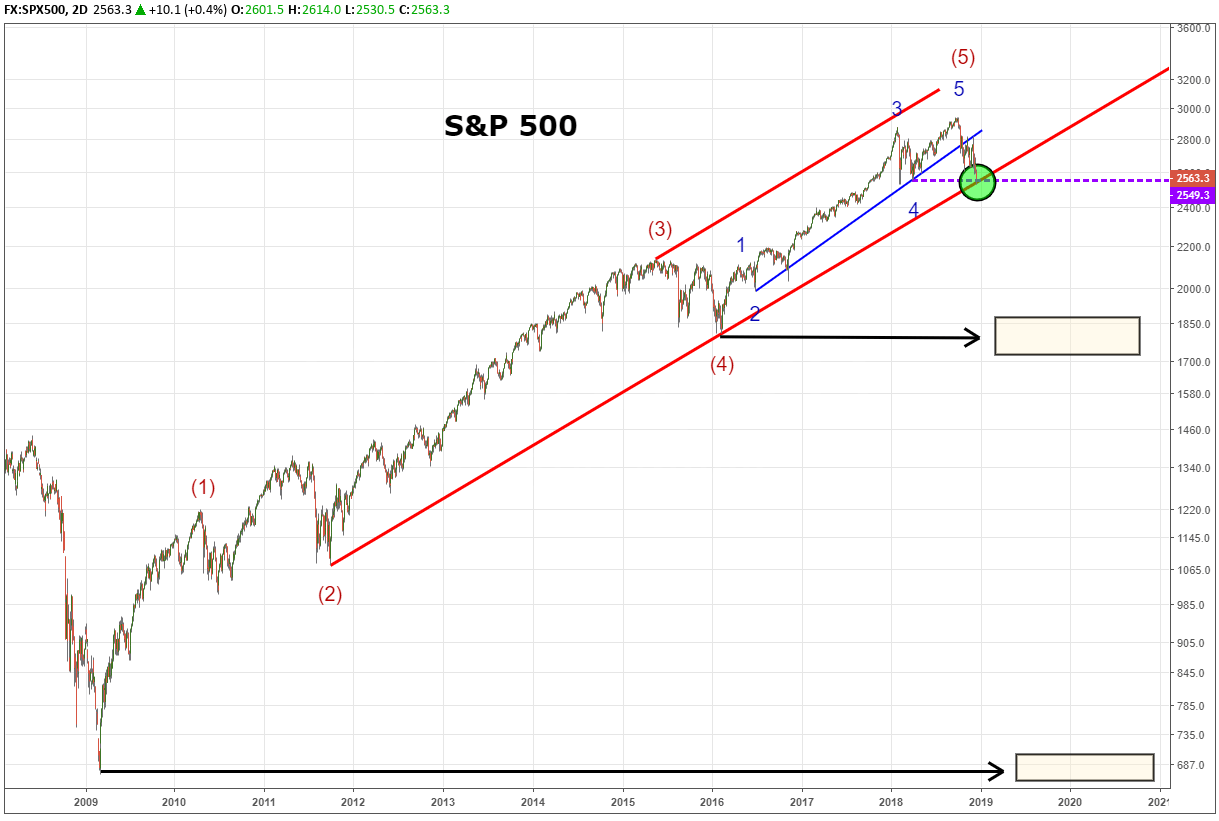
A breakdown below this line suggests the uptrend that began in 2009 is over and it becomes highly probable that a retracement to the previous fourth wave is underway. The previous fourth wave sits at the February 2016 low near 1800 and is over 35% below the October 2018 highs. A move of this magnitude would place S&P 500 in bear market territory.
On a more aggressive note, the wave sequence from the 1932 lows may be considered over as well putting a period to an 87-year wave cycle. Should that be the case, then the entire 2009 – 2018 rally may be retraced with a correction unfolding back to 700.
can the s&p 500 rally to new highs?
Yes, there are wave scenarios that consider a run to new highs but the break of the (2)-(4) Elliott wave trend channel line makes them lower probability.
The break of the (2)-(4) Elliott wave trend channel suggests the bullish impulse wave is over. We can refer to our 8 scenarios after an Elliott wave impulse pattern completesand see that when it involves a termination of a wave five, then a retracement to the previous fourth wave typicall takes place.
what other markets may be affected?
You may have heard the saying birds of a feather flock together. A large S&P 500 correction likely drags lower Dow Jones Industrial Average and Nasdaq 100 as they are all us equity indices. The corresponding (2)-(4) Elliott wave trend channel line sits near 6100 in Nasdaq 100. A breakdown in Nasdaq 100 would add further confirmation to a bearish bias.
Learn more about common Elliott wave patterns by reviewing the beginners and advanced Elliott wave guides.
---Written by Jeremy Wagner, CEWA-M
Jeremy Wagner is a Certified Elliott Wave Analyst with a Master’s designation. Jeremy provides Elliott wave analysis on key markets as well as Elliott wave education resources. Read more of Jeremy’s Elliott wave reports via his bio page.
Communicate with Jeremy and have your shout below by posting in the comments area. Feel free to include your Elliot wave count as well.
Discuss these markets with Jeremy in the Elliott wave specific US Opening Bell webinar.
Follow Jeremy on twitter at @JWagnerFXTrader .
Excent Capital: Supporting The Growth Of LATAM Advisors
The wealth management industry in Latin America is expanding rapidly due to stronger economies and a growing number of... Read more
Parallel Banking: Stablecoins Are Now Global
Parallel Banking: How Stablecoins Are Building a New Global Payments SystemStablecoins—digital currencies pegged to tr... Read more
Industry Responses: Strategies For Overcoming Regulatory Challenges In US Bitcoin ETF Approval
The journey towards the approval of Bitcoin Exchange-Traded Funds (ETFs) in the United States has been fraught with regu... Read more
Navigating Market Volatility: Assessing The Impact Of A Strengthening Dollar On US Stocks
In recent months, US stock markets have experienced a notable rally, with indices reaching new highs. However, amidst th... Read more
Forex Today: BoE & ECB Seen Holding Rates Today - 05 February 2026
Policy Meetings Today at Bank of England and European Central Bank; Tech Stock Selloff Continues; Gold, Silver Consolida... Read more
Blockchain's Truth Machine: How Prediction Markets Are Redefining Global Forecasting - 04 February 2026
Discover how blockchain-based prediction markets like Polymarket are revolutionizing global forecasting with $44 billion... Read more