
Gold Prices Dive For 3 Out Of 4 Days

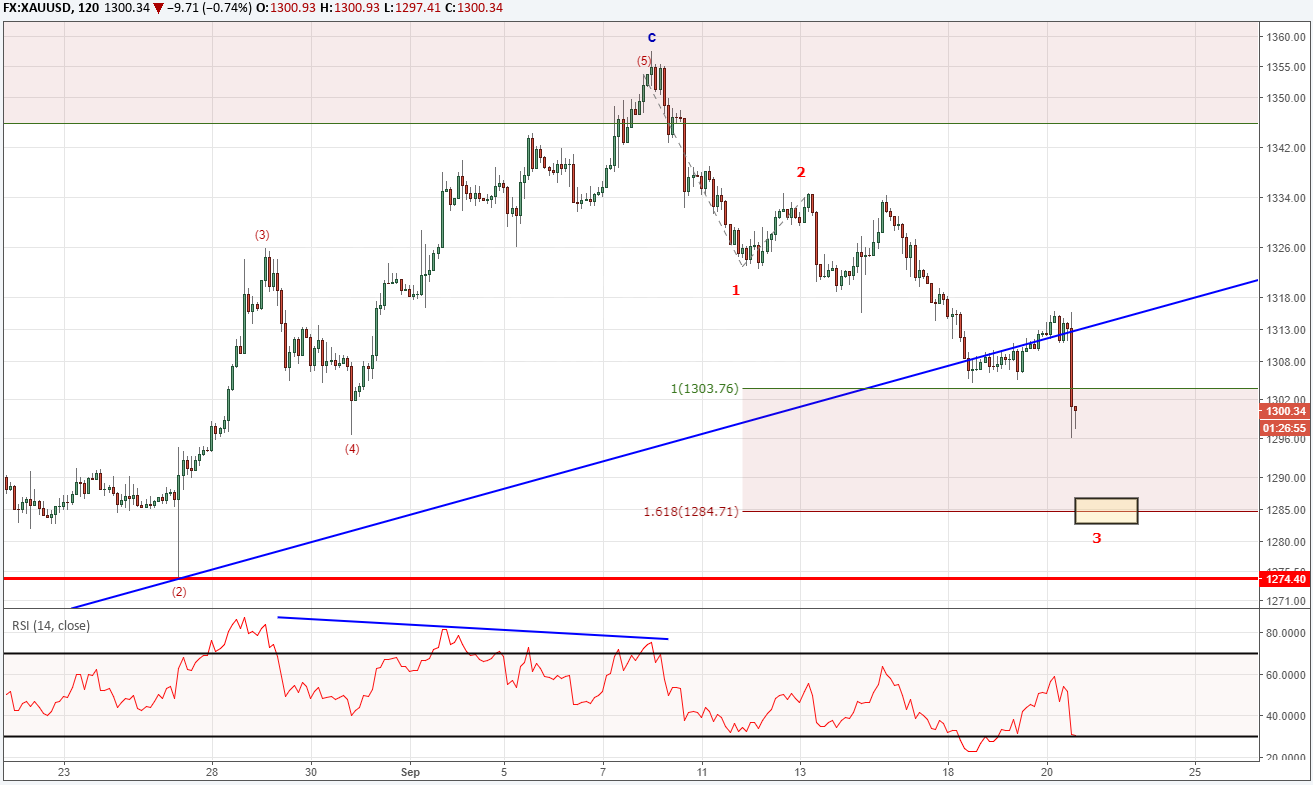
The gold price correction has been more resilient than we have anticipated. Gold prices have sold off about 4% since the September 8 high was registered at $1357. Due to the break below $1300, our models are forecasting and giving more weight to continued weakness.
The chart pattern we are illustrating today is that gold prices finished a ‘C’ wave of a very large triangle pattern. ‘C’ waves of triangles tend to be complex waves and this one fits that bill. Assuming the wave count listed below is correct and then there are a couple of items we can imply:
First, we can anticipate a deep retracement of the December 2016 to September 2017 wave. It would be normal for the ‘D’ wave of this pattern to correct down towards $1215 and possibly even lower. Alternating waves in triangles tend to have Fibonacci proportion to one another. This could drive gold prices down towards $1215.
Secondly, the triangle pattern implies two more waves to finish the triangle, the ‘D’ and ‘E’ waves. The Elliott Wave triangle pattern is a five wave pattern. Since this is a large degree triangle pattern, it may take several months for these final two waves to print.
Lastly, the triangle pattern implies gold prices remain inside the $1357 high and $1122 low while the final two legs are carving. Each wave extreme remains inside the previous wave extreme as prices consolidate the previous large down trend from calendar year 2011 to 2015.
Learn more about triangle patterns by watching this one hour long webinar recording devoted to triangles.

The key to trading in this environment is to watch your support and resistance levels and seek out those opportunities with good risk to reward ratios. For example, closer inspection of an intraday chart for gold hints we may be in the middle of wave 3 lower of a larger impulse wave. This downward impulse hints at continued weakness towards $1285. Student of Elliott Wave Theory will recognize that in an impulse, there is still an outstanding fourth and fifth wave to follow.
The IG Client sentiment reading for gold is at +2.3. The number of trader’s net long gold is beginning to increase again. This could be a clue for bearish traders as the sentiment reading has been increasing for the past week. Follow live trader positioning in gold.
Bottom line, look for gold prices continue its trend lower towards $1285. If gold prices print above the September 12 low of $1324, then we will need to re-evaluate the wave count.
Learn more about the Elliott Wave patterns by receiving our beginner and advanced Elliott Wave guides.
---Written by Jeremy Wagner, CEWA-M
Jeremy is a Certified Elliott Wave Analyst with a Master’s designation. These articles are designed to illustrate Elliott Wave applied to the current market environment.
Discuss this market with Jeremy in Monday’s US Opening Bell webinar.
Follow on twitter @JWagnerFXTrader .
Join Jeremy’s distribution list.
Recent Elliott Wave articles by Jeremy:
USDJPY Advance May Kick Off a New Uptrend
Excent Capital: Supporting The Growth Of LATAM Advisors
The wealth management industry in Latin America is expanding rapidly due to stronger economies and a growing number of... Read more
Parallel Banking: Stablecoins Are Now Global
Parallel Banking: How Stablecoins Are Building a New Global Payments SystemStablecoins—digital currencies pegged to tr... Read more
Industry Responses: Strategies For Overcoming Regulatory Challenges In US Bitcoin ETF Approval
The journey towards the approval of Bitcoin Exchange-Traded Funds (ETFs) in the United States has been fraught with regu... Read more
Navigating Market Volatility: Assessing The Impact Of A Strengthening Dollar On US Stocks
In recent months, US stock markets have experienced a notable rally, with indices reaching new highs. However, amidst th... Read more
Forex Today: BoE & ECB Seen Holding Rates Today - 05 February 2026
Policy Meetings Today at Bank of England and European Central Bank; Tech Stock Selloff Continues; Gold, Silver Consolida... Read more
Blockchain's Truth Machine: How Prediction Markets Are Redefining Global Forecasting - 04 February 2026
Discover how blockchain-based prediction markets like Polymarket are revolutionizing global forecasting with $44 billion... Read more