Gold Price Analysis: The Bullish Pattern Poised For $1375 Retest

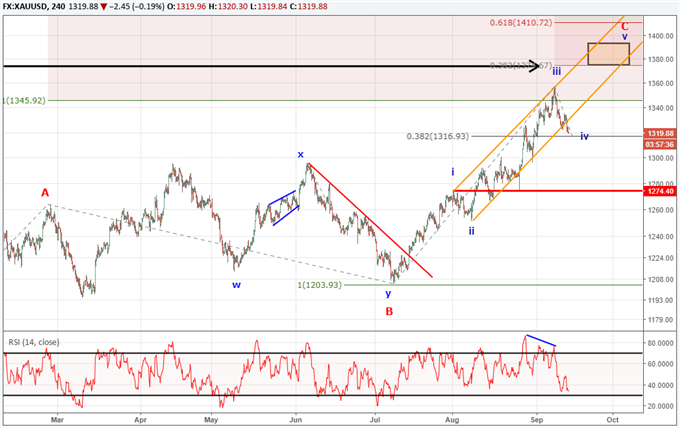
Gold prices have been correcting lower for the past couple days and have reached a zone of interest. The Elliott Wave model we are following hints at support forming between now and $1310. The next move higher then becomes an ending wave.
It appears as though prices are correcting lower in a small degree wave iv. Typically wave iv in an impulse corrects towards the 38% retracement level of wave iii. If my wave labelling is correct, then gold prices may find support near $1317 and possibly down towards $1310. If price corrects below $1274, then the wave count is incorrect and we will reassess what the other models are indicating.
If gold prices are supported in this $1310-$1320 price zone, then we will look for a break higher that tests $1375.
$1375 is a big level for multiple reasons. There is a wave relationship that appears near there. Wave v is .382 the length of waves i-iii. In addition, the July 2016 high circles around in the same price zone. Therefore, we expect a battle between the bulls and bears to occur near this zone. We will likely see a reaction lower, but we cannot rule out a break higher eventually.

The IG Client sentiment reading for gold is at +1.79. The number of traders net long gold have decreased since the beginning of July. This could be a subtle clue for bullish traders as the sentiment reading has been dropping from even more extreme levels. Follow live trader positioning in gold.
Bottom line, look for gold prices to pivot higher near these current levels with a target near $1375. Below $1274 and we will need to reassess the Elliott Wave count.
Learn more about the Elliott Wave patterns by receiving our beginner and advanced Elliott Wave guides.
---Written by Jeremy Wagner, CEWA-M
Jeremy is a Certified Elliott Wave Analyst with a Master’s designation. These articles are designed to illustrate Elliott Wave applied to the current market environment.
This article references an impulse wave. We have a one hour long webinar recording devoted to the topic of Elliott Wave impulses. Register to view it.
Discuss this market with Jeremy in Monday’s US Opening Bell webinar.
Follow on twitter @JWagnerFXTrader .
Join Jeremy’s distribution list.
GBPUSD Elliott Wave pattern clears up.
Copper prices have fallen hard…is this the beginning of a new down trend?
Excent Capital: Supporting The Growth Of LATAM Advisors
The wealth management industry in Latin America is expanding rapidly due to stronger economies and a growing number of... Read more
Parallel Banking: Stablecoins Are Now Global
Parallel Banking: How Stablecoins Are Building a New Global Payments SystemStablecoins—digital currencies pegged to tr... Read more
Industry Responses: Strategies For Overcoming Regulatory Challenges In US Bitcoin ETF Approval
The journey towards the approval of Bitcoin Exchange-Traded Funds (ETFs) in the United States has been fraught with regu... Read more
Navigating Market Volatility: Assessing The Impact Of A Strengthening Dollar On US Stocks
In recent months, US stock markets have experienced a notable rally, with indices reaching new highs. However, amidst th... Read more
Forex Today: BoE & ECB Seen Holding Rates Today - 05 February 2026
Policy Meetings Today at Bank of England and European Central Bank; Tech Stock Selloff Continues; Gold, Silver Consolida... Read more
Blockchain's Truth Machine: How Prediction Markets Are Redefining Global Forecasting - 04 February 2026
Discover how blockchain-based prediction markets like Polymarket are revolutionizing global forecasting with $44 billion... Read more

