GBPUSD Elliott Wave Analysis: Seeking Larger Impulse Waves

GBPUSD Elliott Wave Talking Points:
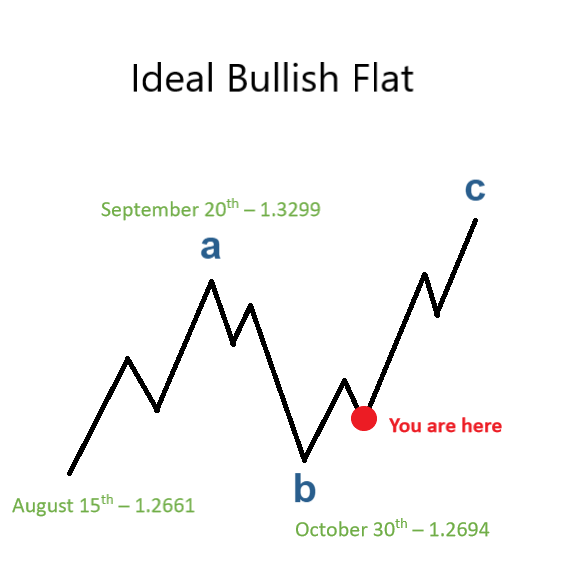
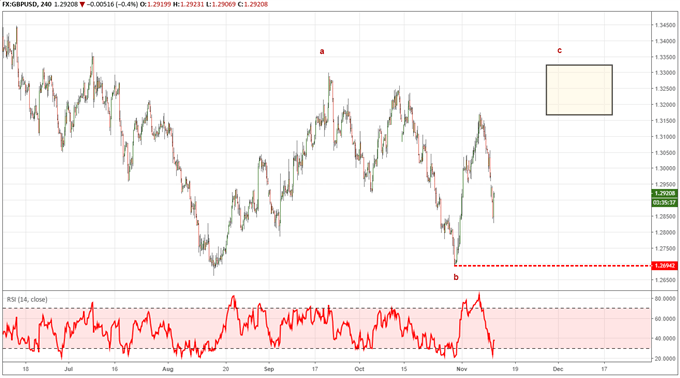
- GBPUSD has rallied and corrected from August 15 to October 30 in a series of three wave patterns indicative of a larger corrective pattern
- If we are in a larger (B) wave pattern, GBPUSD may temporarily rally to 1.3150-1.3300
- A move below 1.2694 suspends the shorter term bullish forecast
GBPUSD has rallied in three waves from the August 15 low to the September 20 high. Then, a correction ensued in three waves from September 20 to the October 30 low. This sequence of three wave moves is indicative of a larger corrective pattern possibly labeled as a-b. Therefore, GBPUSD is looking for an impulse wave to finalize the shorter-term pattern.
If this impulse wave has begun from the October 30 low, then GBPUSD will likely rally again towards 1.3150-1.3300.
The current Elliott Wave for GBPUSD

New to Elliott wave corrective patterns? On page 4 of our Elliott wave Advanced guide, we explain the most common flat patterns, where they occur and the sub-structure of each wave.
There are multiple wave counts that can lead to a sequence of three wave patterns. Due to the October 30 low appearing near the price low of August 15, the scales are tipped towards a larger flat or triangle pattern.
In both instances, when these patterns complete, it would lead to a larger decline in GBPUSD. However, in the shorter term, it does appear as though both of these interpretations are incomplete to the upside.
Using Elliott Wave Theory as our guide, GBPUSD may be in the midst of rallying in a ‘c’ wave higher. We believe this rally is part of a larger (B) wave. Therefore, the current Elliott wave for GBPUSD is wave ‘c’ of (B).
Why is 1.3150 to 1.3300 significant in Cable?
If the ‘c’ wave of the Elliott wave sequence is incomplete, then GBPUSD will likely press through 1.3150 while holding above the October 30 low of 1.2694. If the current wave is ‘c’ of a triangle, then GBPUSD will probably stall in that area. If the current wave is ‘c’ of a bullish flat, then GBPUSD will probably revisit 1.3300 and possibly higher levels.
As mentioned above, there are other patterns formed by a sequence of multiple three-wave moves so as the structure develops we will look to eliminate some of them.

Elliott Wave FAQs
How do you know when a wave is finished?
According to Elliott Wave principle, each wave consists of a certain number of sub-waves depending upon the pattern. Once you can completely count all of the waves present, then the market is at risk of reversal. Naturally, we will not know for sure until some point after the reversal has taken place. However, we can anticipate price zones where a reversal is higher probability. As a trader, once the market reaches those price zones, I wait for a break of support or resistance trend lines to validate my view and enter the trade. Good trading is more than entry or exit signals, it also involves a risk management plan.
Entries are important, but did you know that how you manage your risk is just as crucial? On page 4 of our Building Confidence in Trading we list questions your trading plan should address and answer!
---Written by Jeremy Wagner, CEWA-M
Jeremy Wagner is a Certified Elliott Wave Analyst with a Master’s designation. These articles are designed to illustrate Elliott Wave applied to the current market environment. See Jeremy’s bio page for recent Elliott Wave articles to see Elliott Wave Theory in action.
Communicate with Jeremy and have your shout below by posting in the comments area. Feel free to include your Elliott Wave count as well.
Discuss this market with Jeremy in Monday’s US Opening Bell webinar.
Follow on twitter @JWagnerFXTrader .
Recent Elliott Wave Articles
USDJPY Elliott Wave Analysis: Trying for Higher Levels
EURUSD Elliott Wave Forecast Points Towards Temporary Correction
Excent Capital: Supporting The Growth Of LATAM Advisors
The wealth management industry in Latin America is expanding rapidly due to stronger economies and a growing number of... Read more
Parallel Banking: Stablecoins Are Now Global
Parallel Banking: How Stablecoins Are Building a New Global Payments SystemStablecoins—digital currencies pegged to tr... Read more
Industry Responses: Strategies For Overcoming Regulatory Challenges In US Bitcoin ETF Approval
The journey towards the approval of Bitcoin Exchange-Traded Funds (ETFs) in the United States has been fraught with regu... Read more
Navigating Market Volatility: Assessing The Impact Of A Strengthening Dollar On US Stocks
In recent months, US stock markets have experienced a notable rally, with indices reaching new highs. However, amidst th... Read more
Forex Today: BoE & ECB Seen Holding Rates Today - 05 February 2026
Policy Meetings Today at Bank of England and European Central Bank; Tech Stock Selloff Continues; Gold, Silver Consolida... Read more
Blockchain's Truth Machine: How Prediction Markets Are Redefining Global Forecasting - 04 February 2026
Discover how blockchain-based prediction markets like Polymarket are revolutionizing global forecasting with $44 billion... Read more

