
GBP/USD Approaches Important Long Term Price Zone

In our last report, we noted how the Elliott Wave technical picture cleared up. Though GBP/USD sliced right through 1.3450 like a hot knife cutting through butter, the bigger wave picture is still intact. Despite the Bank of England and market participants believing a rate hike is coming, the technical picture for GBP/USD is not as rosy. We believe Cable is in a terminal wave at three different degrees of trend. This suggests a reversal may be looming overhead.
The Elliott Wave model we are following points our trend “GPS” to the coordinates of wave v of ((C)) of Y of 4. For those familiar with Elliott Wave, those first three coordinates are ending waves. That means once this move higher exhausts, GBP/USD may stage a top that lasts for several months. We are seeing a cluster of wave relationships appear in the 1.3775 to 1.3918 price zone so a reversal (if one happens) may take place there.
Struggling with your trading? This could be why.
Since this could be the final moves of wave 4, that implies a fifth and final wave to come. We know from our Elliott Wave lessons that fourth waves in an impulse do not overlap the price territory of the first wave of the same impulse. In the daily chart below, notice how the first wave low appears at 1.46. Therefore, Cable can technically move up to this level and the larger impulse (which is a bearish impulse) remains intact.
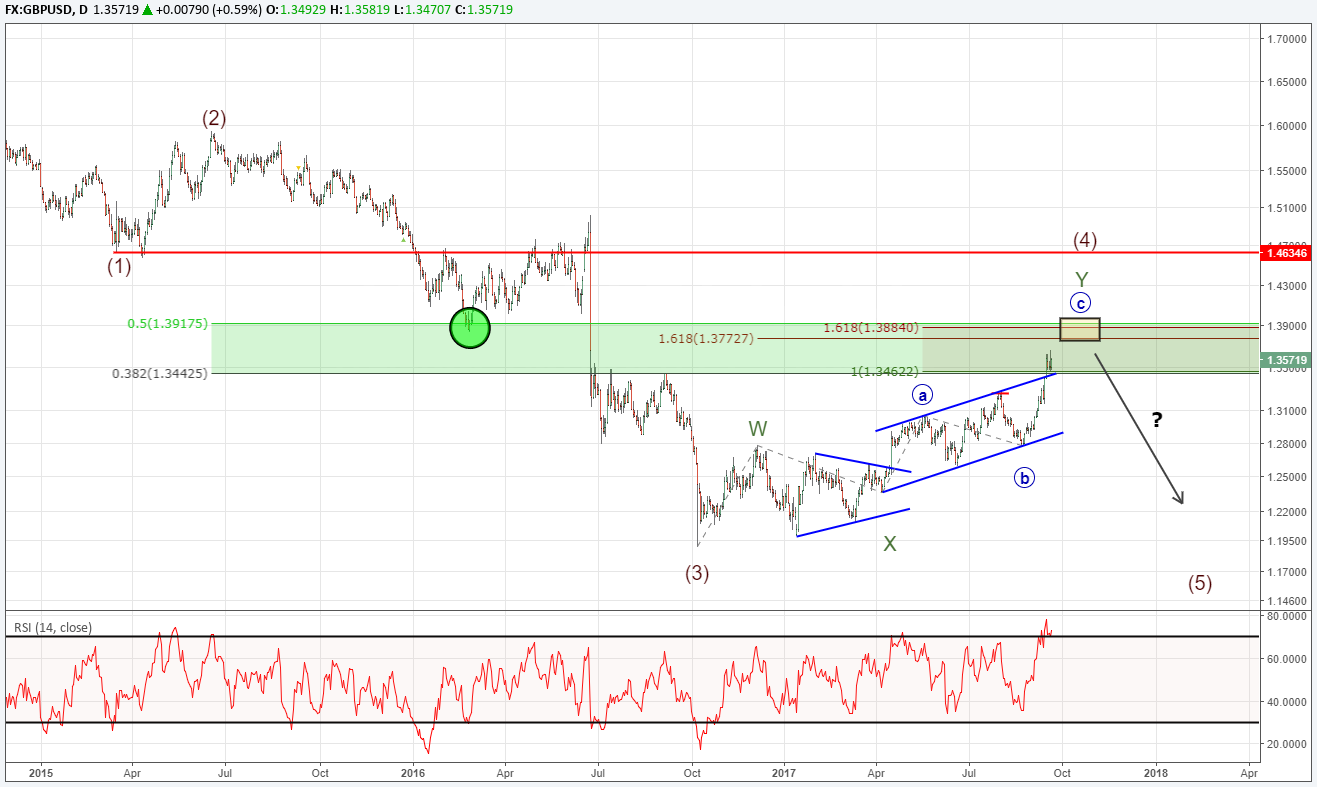
In the chart above, we can see four wave relationships appearing in the 1.3773 to 1.3918 price zone. Plus, there is a fifth wave relationship at 1.3775 which we will talk about in a minute. This indicates the next couple hundred pips are to be closely monitored.
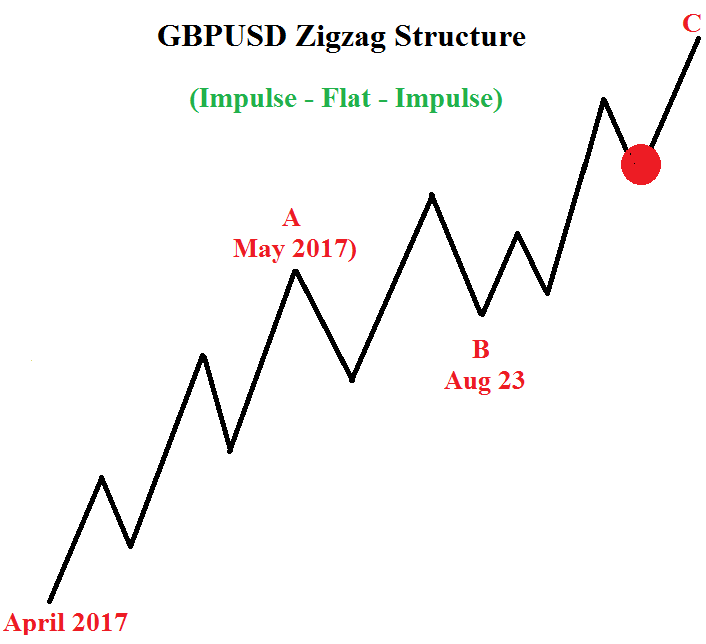
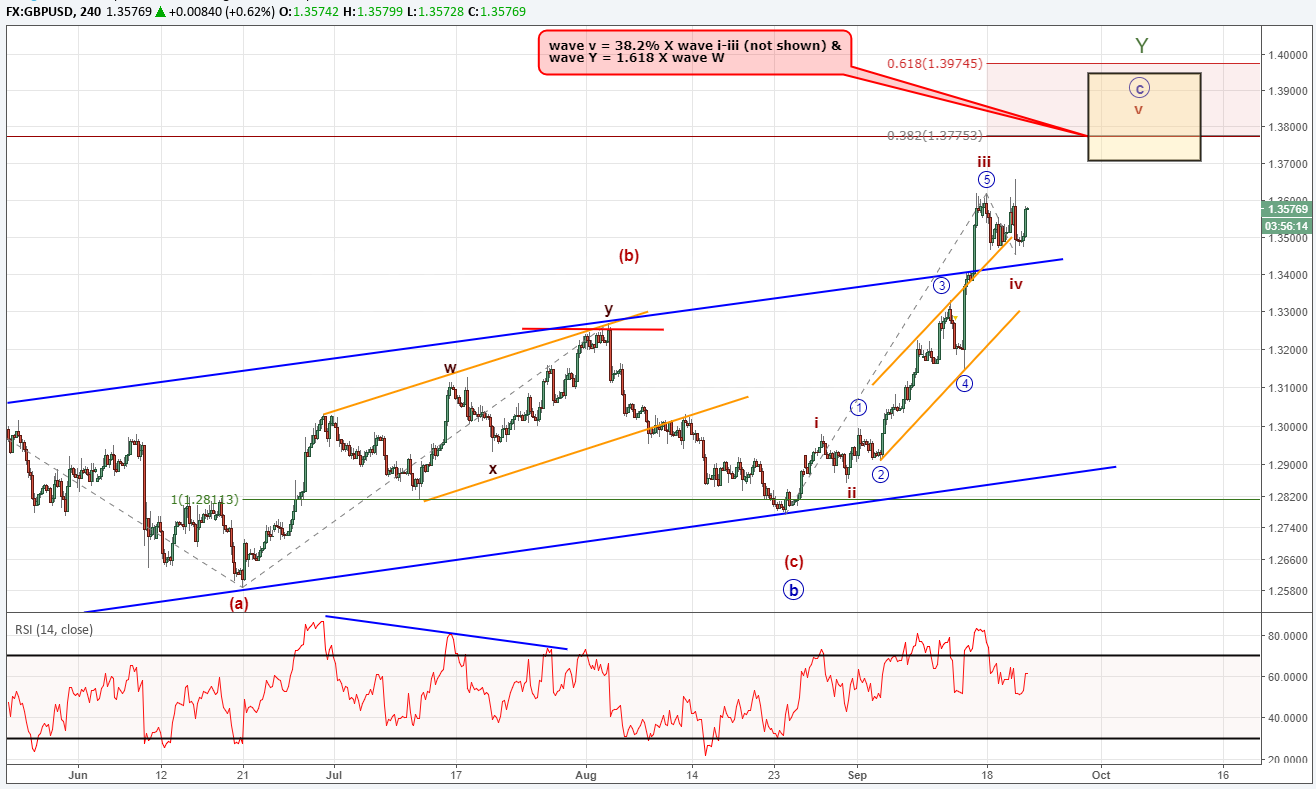
When we zoom into an intraday chart, it appears we are near the beginning of the fifth and final wave higher in the sequence. Below is an idealized chart showing the latest zigzag structure.
From our Elliott Wave studies, we know that fifth waves tend to travel about 38 or 61% the length of waves one through three. Applying this study to our charts we can add another wave relationship to the cluster near 1.3775. Price does not need to make it to this level for the wave picture to remain valid, but the confluence of wave relationships gives us a price zone to watch closely.
Bottom Line
When looking at the intraday chart above, we are waiting for the impulse wave from August 24 to end. There is a cluster of wave relationships on the daily and intraday chart between 1.3773 to 1.3918 which hints Cable may struggle to advance farther beyond that zone. If a reversal is successful, we are anticipating new lows to 1.19.
Get started learning about Elliott Wave. Grab the beginner and advanced Elliott Wave trading guide.
New to FX trading? We created this guide just for you.
---Written by Jeremy Wagner, CEWA-M
Discuss this market with Jeremy in Monday’s US Opening Bell webinar.
For further study on Elliott Wave patterns, watch these one hour long webinar recordings devoted to each topic. [registration required]
Follow on twitter @JWagnerFXTrader .
Join Jeremy’s distribution list.
Recent Elliott Wave articles by Jeremy:
USDJPY Advance May Kick Off a New Uptrend
Excent Capital: Supporting The Growth Of LATAM Advisors
The wealth management industry in Latin America is expanding rapidly due to stronger economies and a growing number of... Read more
Parallel Banking: Stablecoins Are Now Global
Parallel Banking: How Stablecoins Are Building a New Global Payments SystemStablecoins—digital currencies pegged to tr... Read more
Industry Responses: Strategies For Overcoming Regulatory Challenges In US Bitcoin ETF Approval
The journey towards the approval of Bitcoin Exchange-Traded Funds (ETFs) in the United States has been fraught with regu... Read more
Navigating Market Volatility: Assessing The Impact Of A Strengthening Dollar On US Stocks
In recent months, US stock markets have experienced a notable rally, with indices reaching new highs. However, amidst th... Read more
Forex Today: BoE & ECB Seen Holding Rates Today - 05 February 2026
Policy Meetings Today at Bank of England and European Central Bank; Tech Stock Selloff Continues; Gold, Silver Consolida... Read more
Blockchain's Truth Machine: How Prediction Markets Are Redefining Global Forecasting - 04 February 2026
Discover how blockchain-based prediction markets like Polymarket are revolutionizing global forecasting with $44 billion... Read more