
EUR/USD Elliott Wave Analysis: 3 Year Chart Pattern Nears An End

EUR/USD Elliott Wave Analysis Talking Points:
- Three year expanded flat pattern on EURUSD is nearing completion
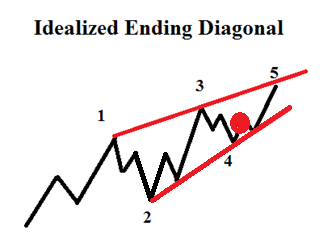
- The final wave of the flat is shaping as ending diagonal
- We are anticipating the diagonal to finish below 1.2288
EUR/USD Elliott Wave analysis shows a three year expanded flat pattern is nearing an end. We are anticipating a bearish reversal that begins from a level below 1.2288.
Elliott Wave Flat Pattern Began in 2015
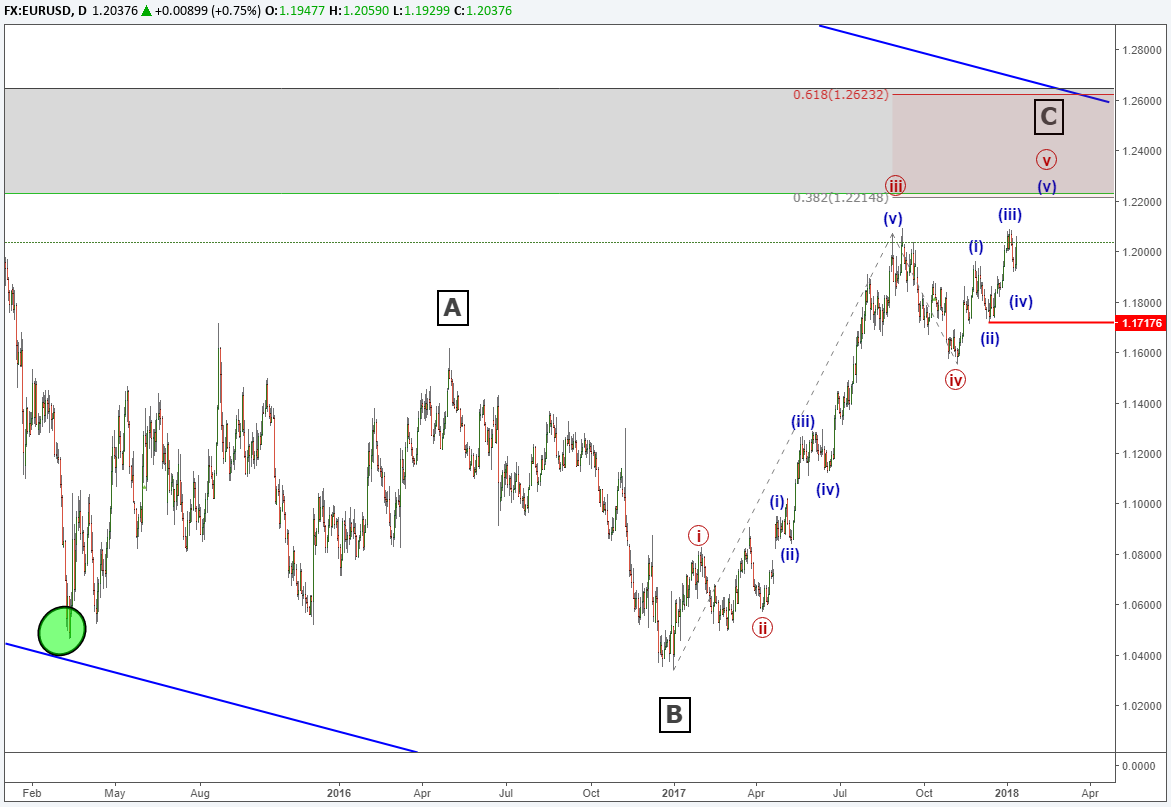
EUR/USD has been correcting sideways since March of 2015 as an A-B-C wave. This three-wave move is shaped as an expanded flat pattern.
According to the Elliott Wave principle, the ‘C’ wave of the flat would need to carve in five waves. We can see from the chart below that the pattern is incomplete with only four waves visible.
EUR/USD Elliott Wave Count
5th Wave Diagonal Nearing an End
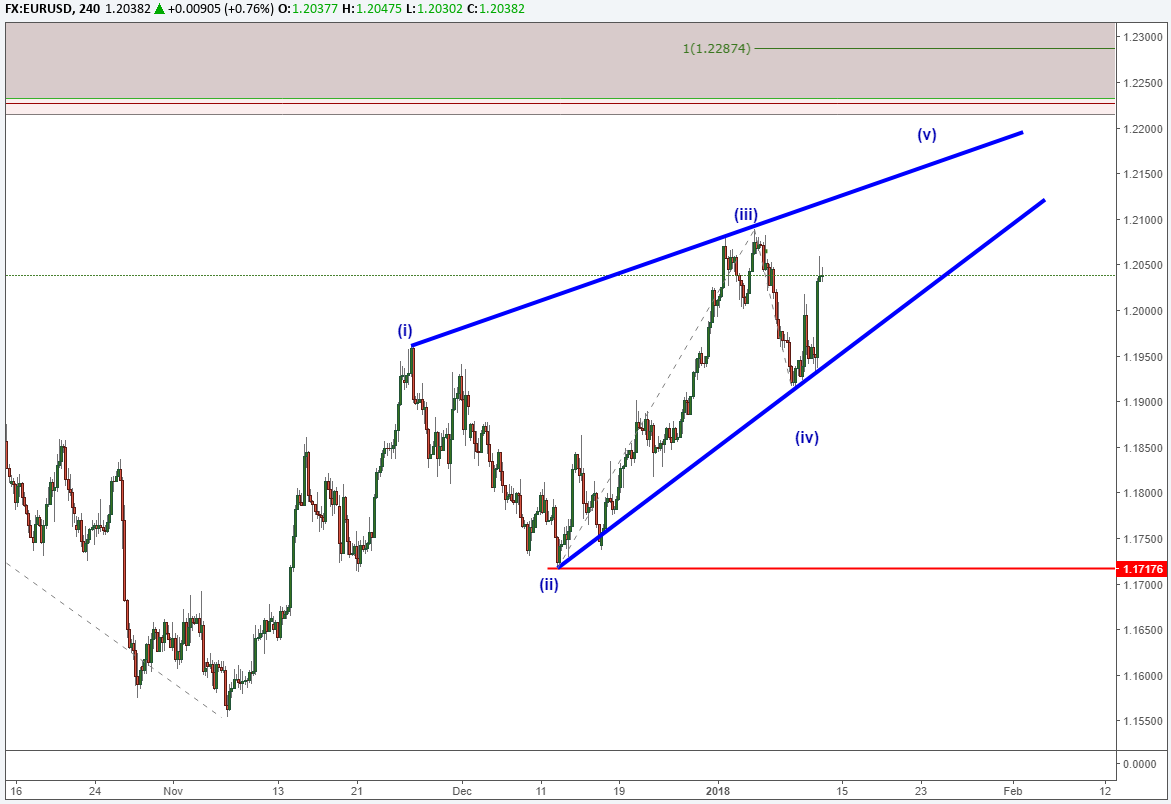
Within the fifth wave of the flat noted above, two possible patterns could develop. The first is an impulse wave. The shape and structure since the 1.1554 low in November is not an impulse wave.
The other possibility is the fifth wave is carving as an ending diagonal pattern. The shape and the structure since 1.1554 does look like the beginning of the diagonal.
The Elliott Wave count on EUR/USD shows we have just completed the fourth wave of that diagonal on January 9 or may do so with one more dip in price. We believe that with EURUSD above 1.18, the diagonal may grind higher in one final wave.
Measuring The EUR/USD Diagonal Pattern's Extreme
In Elliott Wave Theory, one of the rules is that wave 3 cannot be the shortest of waves 1, 3, and 5. In the EURUSD diagonal noted above, wave (iii) is shorter than wave (i). Therefore, to prevent violation of the rule, wave (v) must be shorter than wave (iii) or else we have misdiagnosed the pattern.
We can identify from the EUR/USD chart that wave (iii) measured 371 pips. Therefore, if we project that distance from the January 9 low, then we reach a diagonal extreme of 1.2288.
This implies that so long as EURUSD remains below 1.2288, then the market is at risk of a swift reversal. This offers us an ability to set up a short trade opportunity according to habits of successful traders.
Learn more about the 4 steps to trade the diagonal pattern.
Elliott Wave Theory FAQs
How do I begin my Elliott Wave analysis?
There are certain Elliott Wave patterns that appear in specific places of the wave sequence. I look for those patterns to begin developing my Elliott Wave analysis. Patterns such as triangles, equal waves, the 5-3 pattern, and diagonals are a few that help me get started. We have a one-hour webinar recording on “How to Start Your Elliott Wave Analysis”.
“The Elliott Wave principle seems subjective!”
Well, I would disagree, as the EWP rules are not broken. The challenge is most likely the result of forecasting error. Even I make forecasting mistakes and it happens to everyone as we are assessing a live market environment. One key for budding Elliott Wave technicians is to learn the main patterns, and then minimize those errors by following the larger trend. We discuss this and other expert tips in our beginners and advanced trading guides.
---Written by Jeremy Wagner, CEWA-M
Jeremy Wagner is a Certified Elliott Wave Analyst with a Master’s designation. Jeremy provides Elliott Wave analysis on key markets as well as Elliott Wave educational resources. Read more of Jeremy’s Elliott Wave reports via his bio page.
New to trading FX? This guide is just for you.
Recent Elliott Wave articles by Jeremy:
Will USD/JPY Break its Trading Range?
2018 Forecast for EUR/AUD, GBP/AUD and AUD/JPY
Can Swiss Franc Outperform its Peers in 2018?
Bulls Excited About GBP/JPY Longer Term Elliott Wave Pattern
Follow on twitter @JWagnerFXTrader .
Join Jeremy’s distribution list.
Excent Capital: Supporting The Growth Of LATAM Advisors
The wealth management industry in Latin America is expanding rapidly due to stronger economies and a growing number of... Read more
Parallel Banking: Stablecoins Are Now Global
Parallel Banking: How Stablecoins Are Building a New Global Payments SystemStablecoins—digital currencies pegged to tr... Read more
Industry Responses: Strategies For Overcoming Regulatory Challenges In US Bitcoin ETF Approval
The journey towards the approval of Bitcoin Exchange-Traded Funds (ETFs) in the United States has been fraught with regu... Read more
Navigating Market Volatility: Assessing The Impact Of A Strengthening Dollar On US Stocks
In recent months, US stock markets have experienced a notable rally, with indices reaching new highs. However, amidst th... Read more
Forex Today: BoE & ECB Seen Holding Rates Today - 05 February 2026
Policy Meetings Today at Bank of England and European Central Bank; Tech Stock Selloff Continues; Gold, Silver Consolida... Read more
Blockchain's Truth Machine: How Prediction Markets Are Redefining Global Forecasting - 04 February 2026
Discover how blockchain-based prediction markets like Polymarket are revolutionizing global forecasting with $44 billion... Read more