

EUR/GBP and EUR/CAD Technical Forecast
- British Pound and Canadian Dollar price action against Euro
- EUR/CAD and EUR/GBP price Action
See Our latest trading guides for free and discover what is likely to move the markets through Q4 of this year.
Weaker Euro Across the Board
Last week, Euro softened against some major currencies including Sterling pound and Canadian Dollar. EUR/GBP closed the weekly candlestick with nearly 2.0% loss. On the other hand, EUR/CAD suffered lower loss closing on Firday with only 0.3% loss.
The Relative Strength Index (RSI) crossed below 50 on EUR/GBP indicating to the end of uptrend momentum, and the start of a downtrend move. Meanwhile the oscillator remained flat on EUR/CAD providing zero signal about a clear market dictation.
Having trouble with your trading strategy? Need a hand? Here’s the #1 Mistake That Traders Make
EUR/GBP Daily PRice CHART (April 23, 2017 – OCt 16, 2019) Zoomed Out

EUR/GBP Daily Price CHART (May 8 – Oct 16, 2019) Zoomed in
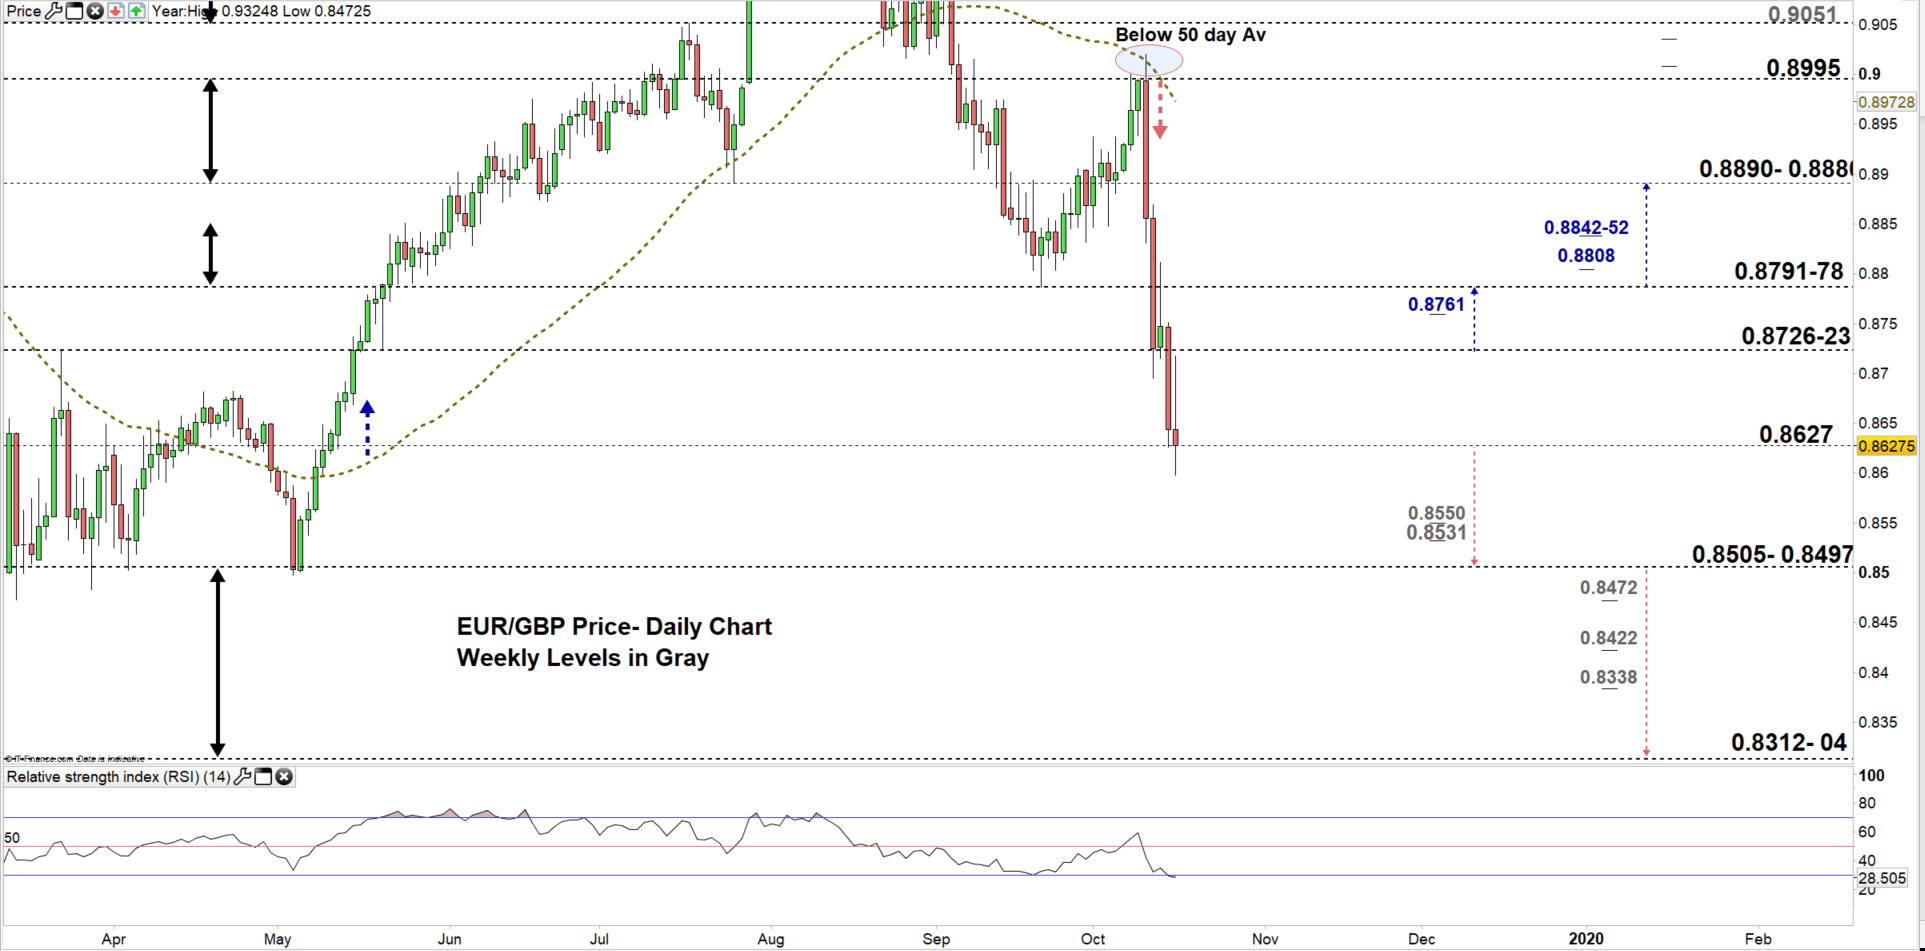
Looking at the daily chart, we notice on Thursday EUR/GBP rallied to its highest level in five weeks however, slipped back later then closed below 50-day average providing a significant bearish signal. This week, the pair continued bearish price action.
Today, EURGBP printed its lowest level in over five months and declined to a lower trading zone 0.8505 – 1.8627. Hence, a close below the high end of the zone could send the price towards the low end. Although, the weekly support levels underlined on the chart (zoomed in) should be considered.
Any Failure in closing below the low end could push EUR/GBP higher towards the vicinity of 0.8726-23. Further close above it may cause a rally towards the higher vicinity of 0.8791-78. That said, the daily resistance levels underscored on the chart should be monitored.
Just getting started?See our Beginners’ Guide for FX traders
EUR/CAD Daily PRice CHART (April 15, 2017– OCt 16, 2019) Zoomed Out

EUR/CAD Daily PRice CHART (May 28 – Oct 16, 2019) Zoomed In
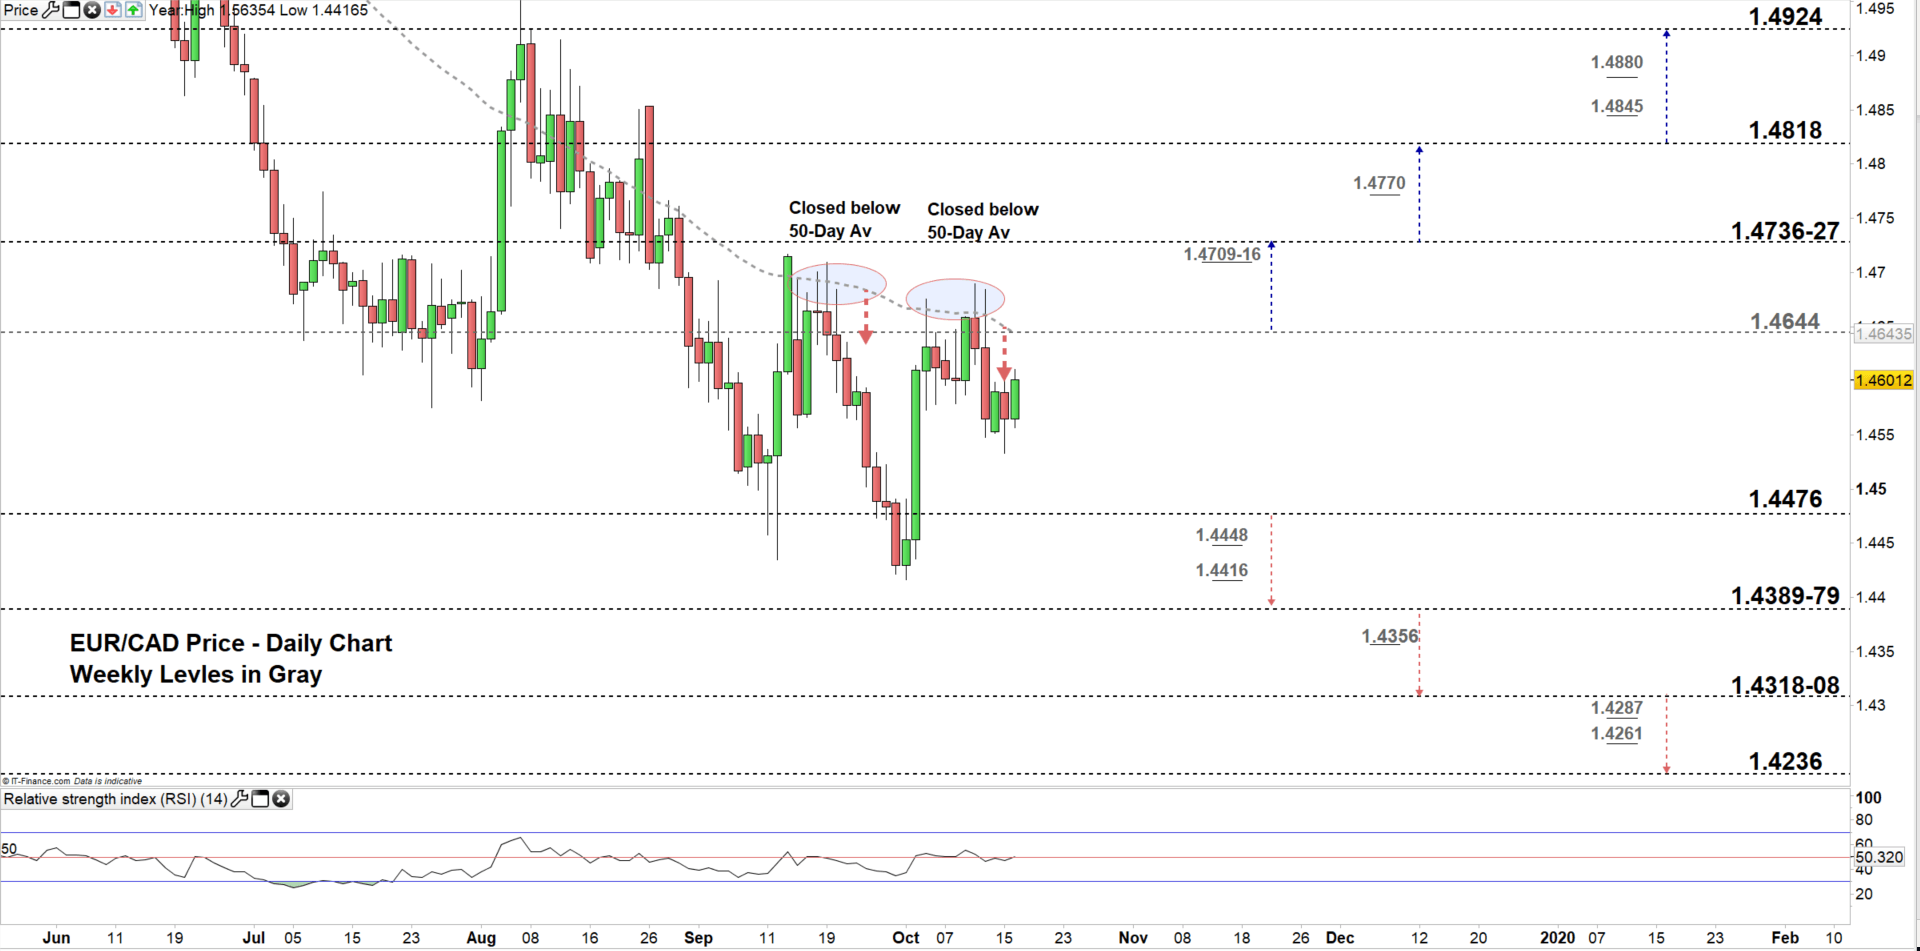
From the daily chart, we notice EUR/CAD failed in multiple occasions to close above 50-day average generating bearish signals, the last one was on Oct 10. In the same day, the pair declined to a lower trading zone 1.4476- 1.4644 providing another bearish signal.
Thus, EURCAD may be on its way for a test of the low end of the zone. Further close below the low end could entice sellers to press the pair even lower towards the vicinity of 1.4389-79. However, the weekly support levels underlined on the chart should be kept in focus.
On the other hand, any U turn of the price would require a close above the high end of the zone which if happens it could push EURCAD towards the vicinity of 1.4736-27. Nevertheless, the weekly resistance area marked on the chart should be watched closely.
Written By: Mahmoud Alkudsi
Please feel free to contact me on Twitter: @Malkudsi