
Elliott Wave Analysis For Copper Prices Suggests Weakness May Be Temporary

Elliott Wave Copper Talking Points:
- Current Elliott Wave for copper is wave 2 of a larger bullish impulse wave
- Alternate counts for copper prices suggest the downward correction may linger on but hold above the 2016 low
- Multiple Elliott Wave patterns target 4.10 and possibly higher levels over the long term in copper
For the past two months, copper prices have been falling hard down nearly 20% since the beginning of June 2018. With the effects of trade wars creating waves through the market, the higher probability move according to Elliott Wave theory is for support to emerge soon pushing copper prices towards 4.10.
What Elliott Wave are we in now?
Pulling out to a weekly chart for copper, we can count an Elliott Wave impulsive move beginning in January 2016. This impulse wave has terminated so according to Elliott Wave theory, we can anticipate a three wave correction to unfold to lower levels labeled A-B-C. It is possible this downward correction is over and support for copper prices may emerge as the proposed wave (2) can be counted as an Elliott Wave flat correction.
If that is the case, then we will look for a wave (3) to unfold to the upside surpassing the January 2018 high and pressure 4.10.
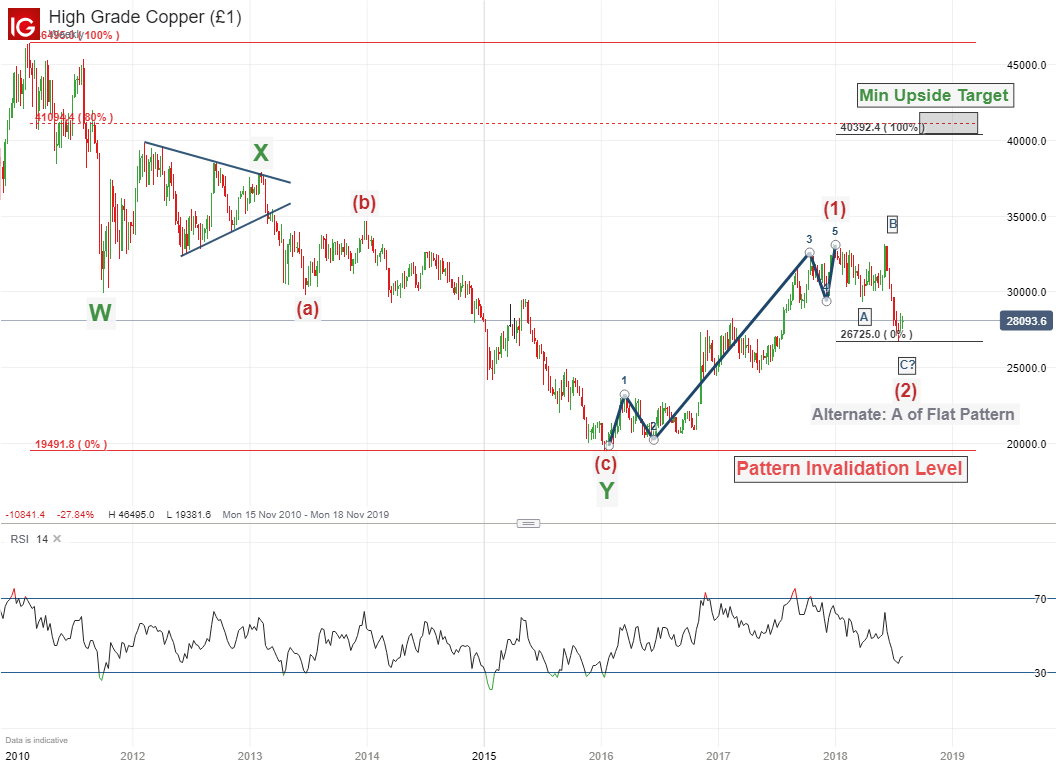
One alternate Elliott Wave count we are watching is the current low in copper price is wave ‘A’ of (2). This implies a larger flat pattern unfolding in the near term and suggests a rally back to 3.17 to 3.46 in wave ‘B’ of the flat.
There is another alternate that suggests the current low in copper price is wave ‘W’ of a complex correction. The result of this pattern would be similar to the chart above with the biggest difference being copper may correct to slightly lower levels.
The Elliott Wave forecast described above is valid so long as copper prices remain above the 2016 low of 1.94. It is important to understand that wave (2) can correct deeper in the near term. There is some congestion surrounding the 2.50 mark so a dip into that zone would be considered normal.
Please note it has been a long time (nearly 10 months) since we published our previous Elliott Wave analysis for copper. A lesson one can take away from that report “Beginning of a New Down Trend?” is how Elliott Wave theory can help you identify the maturity of the trend as copper prices did fall into the cited zone a few days later.
What are the fundamental factors affecting copper prices? Copper is a key market that has been caught in the cross fire of trade wars.
Copper Elliott Wave FAQs
How do I know where to start counting Elliott waves?
This is one of the most common questions asked of Elliott Wave theory. I look for discernable patterns that tip me off where the trend is at within the Elliott Wave sequence. For example, discernable patterns I look for include the 5-3 pattern, equal wave pattern, and Elliott Wave triangles. In the example above there was an ‘X’ wave triangle (in 2012) that suggests the entire 2010-2016 downtrend is corrective and likely to be retraced. Therefore, when an impulse wave develops, this is the first major clue that the 2016 low is an important low. As a result, we can begin counting our Elliott Wave from the 2016 low.
For more on this topic, review our Elliott Wave trading webinar “how do you begin counting waves”.
How does Elliott Wave theory work?
Elliott Wave theory is a trading study that identifies the highs and lows of price movements on charts via wave patterns. Traders analyze the waves for 5-wave moves and 3-wave corrections to determine where the market is at within the larger pattern. Additionally, the theory maintains three rules and several guidelines on the depth of the waves related to one another. Therefore, it is common to use Fibonacci with Elliott Wave analysis together. We cover these topics in our beginners and advanced Elliott Wave trading guides.
---Written by Jeremy Wagner, CEWA-M
Jeremy Wagner is a Certified Elliott Wave Analyst with a Master’s designation. Jeremy provides Elliott Wave analysis on key markets as well as Elliott Wave educational resources. Read more of Jeremy’s Elliott Wave reports via his bio page.
Communicate with Jeremy and have your shout below by posting in the comments area. Feel free to include your Elliott Wave count as well.
Follow on twitter @JWagnerFXTrader .
Excent Capital: Supporting The Growth Of LATAM Advisors
The wealth management industry in Latin America is expanding rapidly due to stronger economies and a growing number of... Read more
Parallel Banking: Stablecoins Are Now Global
Parallel Banking: How Stablecoins Are Building a New Global Payments SystemStablecoins—digital currencies pegged to tr... Read more
Industry Responses: Strategies For Overcoming Regulatory Challenges In US Bitcoin ETF Approval
The journey towards the approval of Bitcoin Exchange-Traded Funds (ETFs) in the United States has been fraught with regu... Read more
Navigating Market Volatility: Assessing The Impact Of A Strengthening Dollar On US Stocks
In recent months, US stock markets have experienced a notable rally, with indices reaching new highs. However, amidst th... Read more
Forex Today: BoE & ECB Seen Holding Rates Today - 05 February 2026
Policy Meetings Today at Bank of England and European Central Bank; Tech Stock Selloff Continues; Gold, Silver Consolida... Read more
Blockchain's Truth Machine: How Prediction Markets Are Redefining Global Forecasting - 04 February 2026
Discover how blockchain-based prediction markets like Polymarket are revolutionizing global forecasting with $44 billion... Read more