
Elliott Wave Analysis: Dow Jones, Nasdaq, And Dax 30 Dive Impulsively

Dow Jones, Nasdaq, Dax 30 Elliott Wave Analysis Talking Points
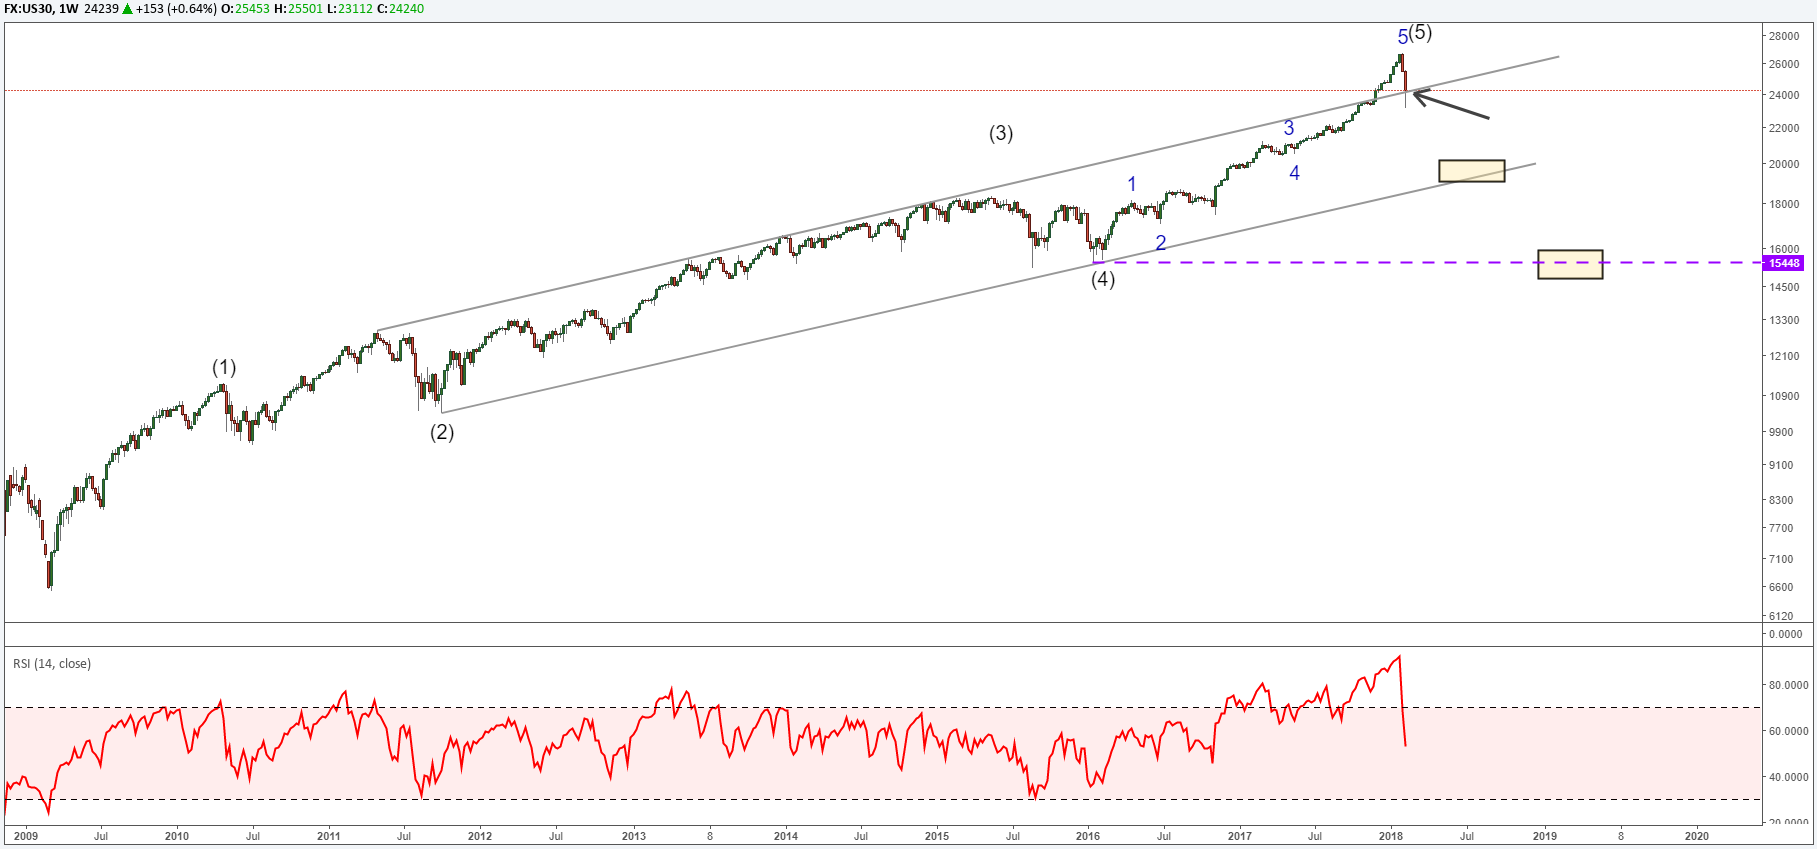
- Dow Jones Industrial Average holds above Elliott Wave channel
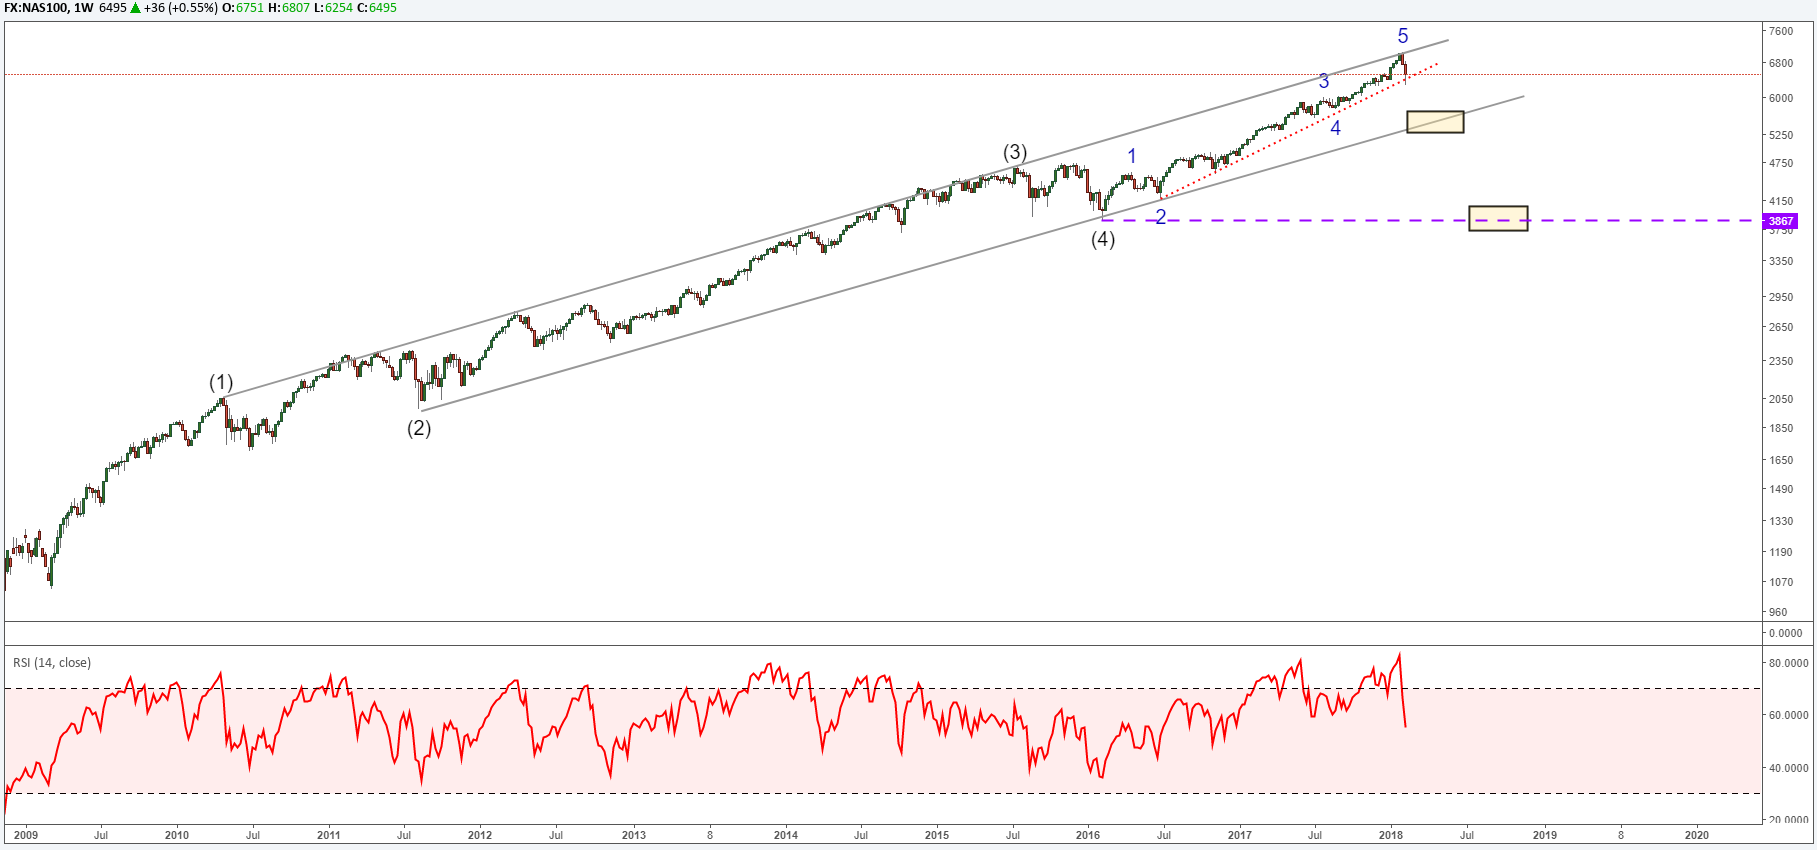
- Nasdaq bearish reversal at Elliott Wave channel
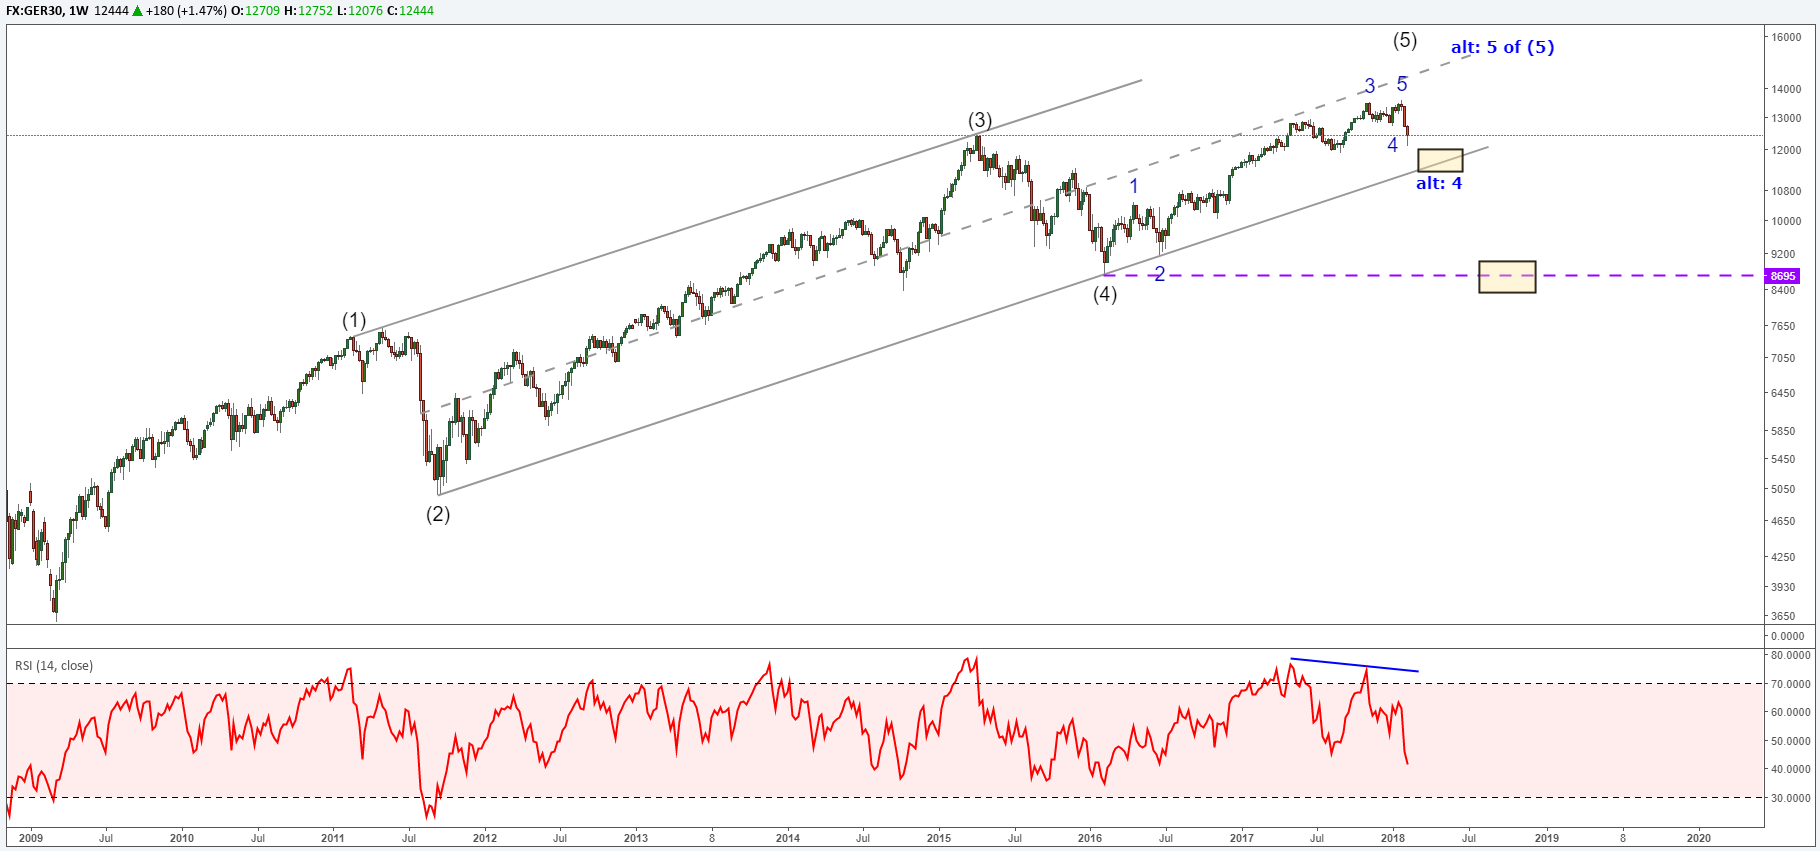
- Dax 30 is the weakest as it could not reach Elliott Wave channel midline
As investors search for reasons why the largest correction in years is occurring, traders look to the technical charts. Our Elliott Wave analysis for Dow Jones, Nasdaq, and Dax 30 shows a wave picture that is likely incomplete to the downside.
Dow Jones Industrial Average Sticks on Top of Elliott Wave Channel
Many times Elliott Wave impulses form a price channel by connecting the extremes of waves 2 and 4 and projecting it over wave 3. Dow Jones Industrial Average has rallied past the upper channel line in a blow off top. Returning inside the Elliott Wave channel can be a signal that the rally is over. Dow Jones Industrial Average is hovering near the channel line so continued weakness in the market may confirm the top is in.
If DJIA is successful in returning inside the Elliott Wave channel, then the next level of support enters the picture near the lower channel boundary near 20,000. If this area fails to contain DJIA, then the next level of support is near the fourth wave extreme at 15,500.
Nasdaq Reverses at Elliott Wave Channel High and Targets 5300
As discussed above, the Elliott Wave channel can offer target zones within an impulse wave. Nasdaq has rallied since 2009 in a five-wave impulse reaching the upper channel line. There is a small internal support trend line Nasdaq is trying to pierce. If it is successful, then continued weakness is anticipated to lower channel support near 5300.
If Nasdaq cannot find support at the lower channel line, then we will look for continued weakness to the fourth wave extreme near 3900.
Dax 30 Cannot Reach Its Elliott Wave Channel Midline
Notice the difference in Dax 30 relative to Dow Jones Industrial Average or Nasdaq. Dax 30 could not rally to the grey dotted line that represents the midline of the Elliott Wave channel. This is indicative of a very weak market.
The lower channel line may provide temporary support near 11,500. If Dax 30 is able to rally to new highs from this level, then we can count it simply as a wave 4 (the alternate shown on the chart). If Dax 30 breaks outside of the Elliott Wave channel below 11,500, then we will look at the fourth wave extreme near 8700 as the next level of support.
The bottom line for all three markets noted above is that absent an immediate print to new highs, this bearish sequence appears incomplete and trade make take place to lower levels in the coming weeks.
Elliott Wave FAQs
What is Elliott Wave Theory?
Elliott Wave Theory is a trading study that identifies the highs and lows of price movements on charts via wave patterns. Traders often analyze the 5-wave impulse sequence and 3-wave corrective sequence to help them trade strategically. We cover these wave sequences in our beginners and advanced Elliott Wave trading guides.
I hear that many traders struggle with profitability, why?
Regardless of the style of analysis, many traders do lose money because they do not take the time to study the market and the effect of leverage. At DailyFX, we have studied millions of live trades and boiled our study down into a Traits of Successful Traders guide. You will find how leverage and human nature affects our trading so you can be better prepared for the next correction.
Elliott Wave Theory can be applied to a variety of highly liquid markets. FX is one of my favorite markets to apply the Elliott Wave principle. Learn more about trading FX with this guide specifically designed for you.
---Written by Jeremy Wagner, CEWA-M
Jeremy is a Certified Elliott Wave Analyst with a Master’s designation. These articles are designed to illustrate Elliott Wave applied to the current market environment.
Communicate with Jeremy and have your shout below by posting in the comments area. Feel free to include your Elliott Wave count as well.
Discuss this market with Jeremy in Monday’s US Opening Bell webinar.
Follow on twitter @JWagnerFXTrader .
Excent Capital: Supporting The Growth Of LATAM Advisors
The wealth management industry in Latin America is expanding rapidly due to stronger economies and a growing number of... Read more
Parallel Banking: Stablecoins Are Now Global
Parallel Banking: How Stablecoins Are Building a New Global Payments SystemStablecoins—digital currencies pegged to tr... Read more
Industry Responses: Strategies For Overcoming Regulatory Challenges In US Bitcoin ETF Approval
The journey towards the approval of Bitcoin Exchange-Traded Funds (ETFs) in the United States has been fraught with regu... Read more
Navigating Market Volatility: Assessing The Impact Of A Strengthening Dollar On US Stocks
In recent months, US stock markets have experienced a notable rally, with indices reaching new highs. However, amidst th... Read more
Forex Today: BoE & ECB Seen Holding Rates Today - 05 February 2026
Policy Meetings Today at Bank of England and European Central Bank; Tech Stock Selloff Continues; Gold, Silver Consolida... Read more
Blockchain's Truth Machine: How Prediction Markets Are Redefining Global Forecasting - 04 February 2026
Discover how blockchain-based prediction markets like Polymarket are revolutionizing global forecasting with $44 billion... Read more