
DJIA Momentum Diverges From Price

Dow Jones Industrial Average is trying to finish the week on a higher note as it is up fractionally since last Friday. The DJIA is drifting higher for the past week, momentum oscillators and Elliott Wave models are flashing yellow lights.
In our previous report we shared how a cluster of wave relationships and trend channels are converging near the current DJIA price level. DJIA appears to be respecting these levels as price has been unable to punch materially higher.
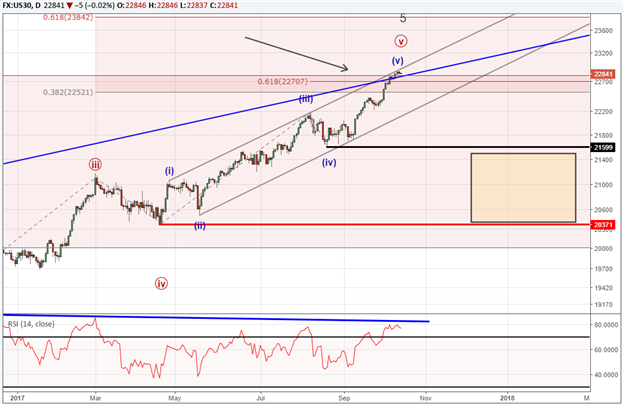
Oscillators, such as the Relative Strength Index (RSI) are diverging with previous DJIA price peaks indicating momentum is slowing and possibly at risk of a reversal.
Wave (v) is painting a compelling picture of at least a shorter term correction. When you connect wave (ii) and wave (iv) with a trend line and duplicate it to the top of wave (iii), many times wave (v) reaches the top of that channel. That is where DJIA is currently parked so the odds of a reversal or increasing.
In situations like these, traders look to tighten up risk levels or lighten exposure in the market in case of a correction. We feel like there are two compelling patterns to keep an eye on. One is a deep reversal and the second is a more shallow reversal to 20,371 to 21,600.
Bottom line, the current trend is still considered higher so we are not looking to position short. We are seeing yellow lights flashing so look to tighten risk and begin to identify bearish patterns if they print.
The DJIA trend is quite mature so have an exit plan ready before you enter. Read other traits we found of successful traders here.
Want to learn more about Elliott Wave analysis? Grab the Beginner and Advanced Elliott Wave guides.
---Written by Jeremy Wagner, CEWA-M
Discuss this market with Jeremy in Monday’s US Opening Bell webinar.
Follow on twitter @JWagnerFXTrader .
Recent Elliott Wave articles by Jeremy:
EURUSD pattern looks to be attracted to 1.20.
Gold prices may find temporary relief.
DJIA doesn’t look like the only market with a big reversal nearby. GBPUSD approaches an important long term price zone too.
USDJPY Advance May Kick Off a New Uptrend
Elliott Wave Patterns: What is a Zigzag? (Educational)
3 Elliott Wave Flat Patterns to Know and Understand (Educational)
Other Elliott Wave resources include one hour webinar recordings on the specific patterns:
Elliott Wave Impulse Patterns
Elliott Wave Zigzag Patterns
Elliott Wave Flat Patterns
Elliott Wave Triangle Patterns
Elliott Wave Diagonal Patterns
Starting Your Elliott Wave Counting
Excent Capital: Supporting The Growth Of LATAM Advisors
The wealth management industry in Latin America is expanding rapidly due to stronger economies and a growing number of... Read more
Parallel Banking: Stablecoins Are Now Global
Parallel Banking: How Stablecoins Are Building a New Global Payments SystemStablecoins—digital currencies pegged to tr... Read more
Industry Responses: Strategies For Overcoming Regulatory Challenges In US Bitcoin ETF Approval
The journey towards the approval of Bitcoin Exchange-Traded Funds (ETFs) in the United States has been fraught with regu... Read more
Navigating Market Volatility: Assessing The Impact Of A Strengthening Dollar On US Stocks
In recent months, US stock markets have experienced a notable rally, with indices reaching new highs. However, amidst th... Read more
Forex Today: BoE & ECB Seen Holding Rates Today - 05 February 2026
Policy Meetings Today at Bank of England and European Central Bank; Tech Stock Selloff Continues; Gold, Silver Consolida... Read more
Blockchain's Truth Machine: How Prediction Markets Are Redefining Global Forecasting - 04 February 2026
Discover how blockchain-based prediction markets like Polymarket are revolutionizing global forecasting with $44 billion... Read more