
Crude Oil Prices Reach Highest Level Since July 2015 - How Much Farther?

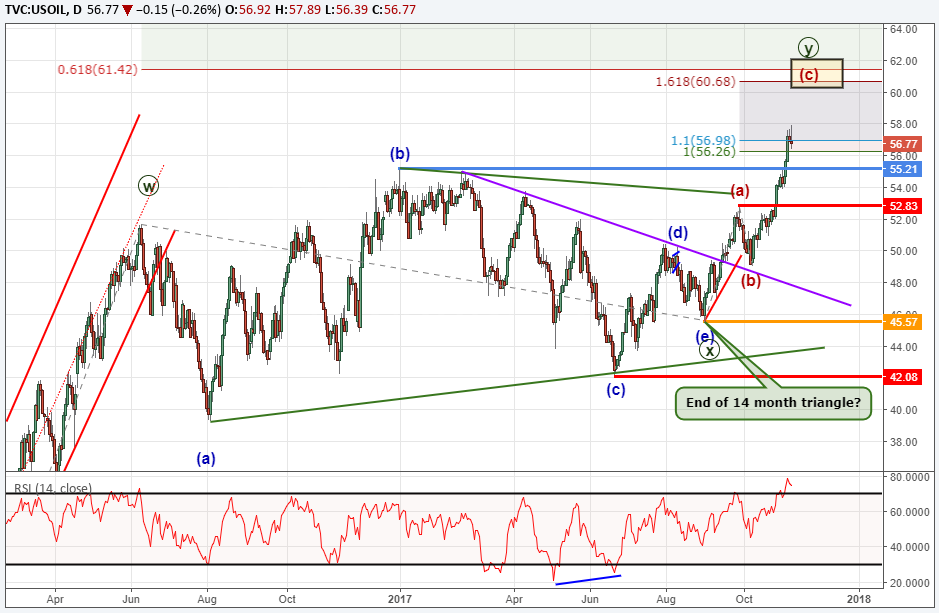
Crude oil prices have finally broken above its two year price range to reach its highest level since July 2015. The sideways consolidation in crude oil charts best as a sideways triangle consolidation.
The Elliott Wave model we have been following has anticipated the bullish triangle and that crude oil may see further strength. The model notes the triangle terminated on August 31, 2017 and that the triangle was an ‘X’ wave of a W-X-Y wave. Therefore, the break higher suggests we are in the ‘Y’ wave. The ‘Y’ wave can take a couple different forms. The most likely form would be a zigzag.
There are a few guidelines to the formation of a zigzag. At today’s high, one possibility is that crude oil satisfied minimum requirements for this zigzag. If that pattern holds, then crude oil may be on the front edges of a long decline back towards the 2016 lows.
We are not certain of those odds. The momentum has been strong to the upside so we need to be mindful that crude oil prices may continue to work higher. The next wave relationship comes in near $61 per barrel. If price does continue higher, look for a stronger reaction to take place near $60.70 to $61.50.
Bottom line, we are in a terminal or ending wave of a two year sequence. If crude oil prices continue to shoot higher, look for stronger resistance to form near $61 per barrel.
Struggling with your trading? You could be making this common trading mistake.
---Written by Jeremy Wagner, CEWA-M
Jeremy is a Certified Elliott Wave Analyst with a Master’s designation. For more learning material on Elliott Wave theory, consider the following:
Beginner and Advanced Guides on Trading with Elliott Wave
Learn more on triangle patterns by viewing this hour-long webinar recording on how to identify and trade triangles...registration required.
Discuss this market with Jeremy in Monday’s US Opening Bell webinar.
Follow on twitter @JWagnerFXTrader .
Join Jeremy’s distribution list.
Other Elliott Wave forecasts by Jeremy:
Short term EURUSD Pattern Hints at Bounce to 1.17.
Gold price forecast points towards lower levels.
NZDUSD Elliott Wave Analysis: Temporary Relief Rallies
USD/JPY stalls but holds above support.
Price action analysis for AUDUSD, NZDUSD, EURUSD [Webinar recording]
Excent Capital: Supporting The Growth Of LATAM Advisors
The wealth management industry in Latin America is expanding rapidly due to stronger economies and a growing number of... Read more
Parallel Banking: Stablecoins Are Now Global
Parallel Banking: How Stablecoins Are Building a New Global Payments SystemStablecoins—digital currencies pegged to tr... Read more
Industry Responses: Strategies For Overcoming Regulatory Challenges In US Bitcoin ETF Approval
The journey towards the approval of Bitcoin Exchange-Traded Funds (ETFs) in the United States has been fraught with regu... Read more
Navigating Market Volatility: Assessing The Impact Of A Strengthening Dollar On US Stocks
In recent months, US stock markets have experienced a notable rally, with indices reaching new highs. However, amidst th... Read more
Forex Today: BoE & ECB Seen Holding Rates Today - 05 February 2026
Policy Meetings Today at Bank of England and European Central Bank; Tech Stock Selloff Continues; Gold, Silver Consolida... Read more
Blockchain's Truth Machine: How Prediction Markets Are Redefining Global Forecasting - 04 February 2026
Discover how blockchain-based prediction markets like Polymarket are revolutionizing global forecasting with $44 billion... Read more