
XRP Price Set For Breakout As Ripple ETF And CME Futures Cross Key Milestones

XRP price rose by over 3% today, Oct. 24, as the crypto market rebounded, following encouraging Ripple ETF and options news.
Summary
- XRP price has formed an inverse head-and-shoulders pattern.
- The XXRP ETF assets have crossed the important milestone of $100 million.
- More data shows that CME futures have crossed $26 billion in volume.
Ripple (XRP) token jumped to $2.4655, up by 80% from its lowest level this month. It has also formed a highly encouraging bullish pattern on the shorter time frame.
XRP ETF crosses $100M and futures activity surges
The XRP price tilted upwards as data showed resilient demand for the token. Data on the REX-Osprey’s website shows that the recently launched XRPR ETF crossed the $100 million asset milestone this week.
The fund now holds over $100.89 million in assets, making it one of the biggest altcoin ETFs in the industry. Its growth is notable as it has an expense ratio of 0.75%, making it more expensive than other spot Bitcoin (BTC) and Ethereum (ETH) ETFs.
The inflows are also notable as they are happening as the coin remains in a deep bear market after falling by over 32% from its highest point this year. In most cases, cryptocurrency and stock ETFs experience weak inflows during bear markets.
XXRP’s performance means that other XRP ETFs by companies like Franklin Templeton and 21Shares will have robust demand. For one, they will be based on the Securities Act of 1933, which is different from the ‘40 Act. They will also have lower fees than the REX-Osprey one.
The other notable XRP news came from CME Group. In an X post, the company said that the recently launched XRP and Micro XRP futures had handled over 567k contracts with a notional value of over $26 billion. This makes XRP one of the most actively traded assets in the company.
https://twitter.com/CMEGroup/status/1981359956822565083
XRP price technical analysis
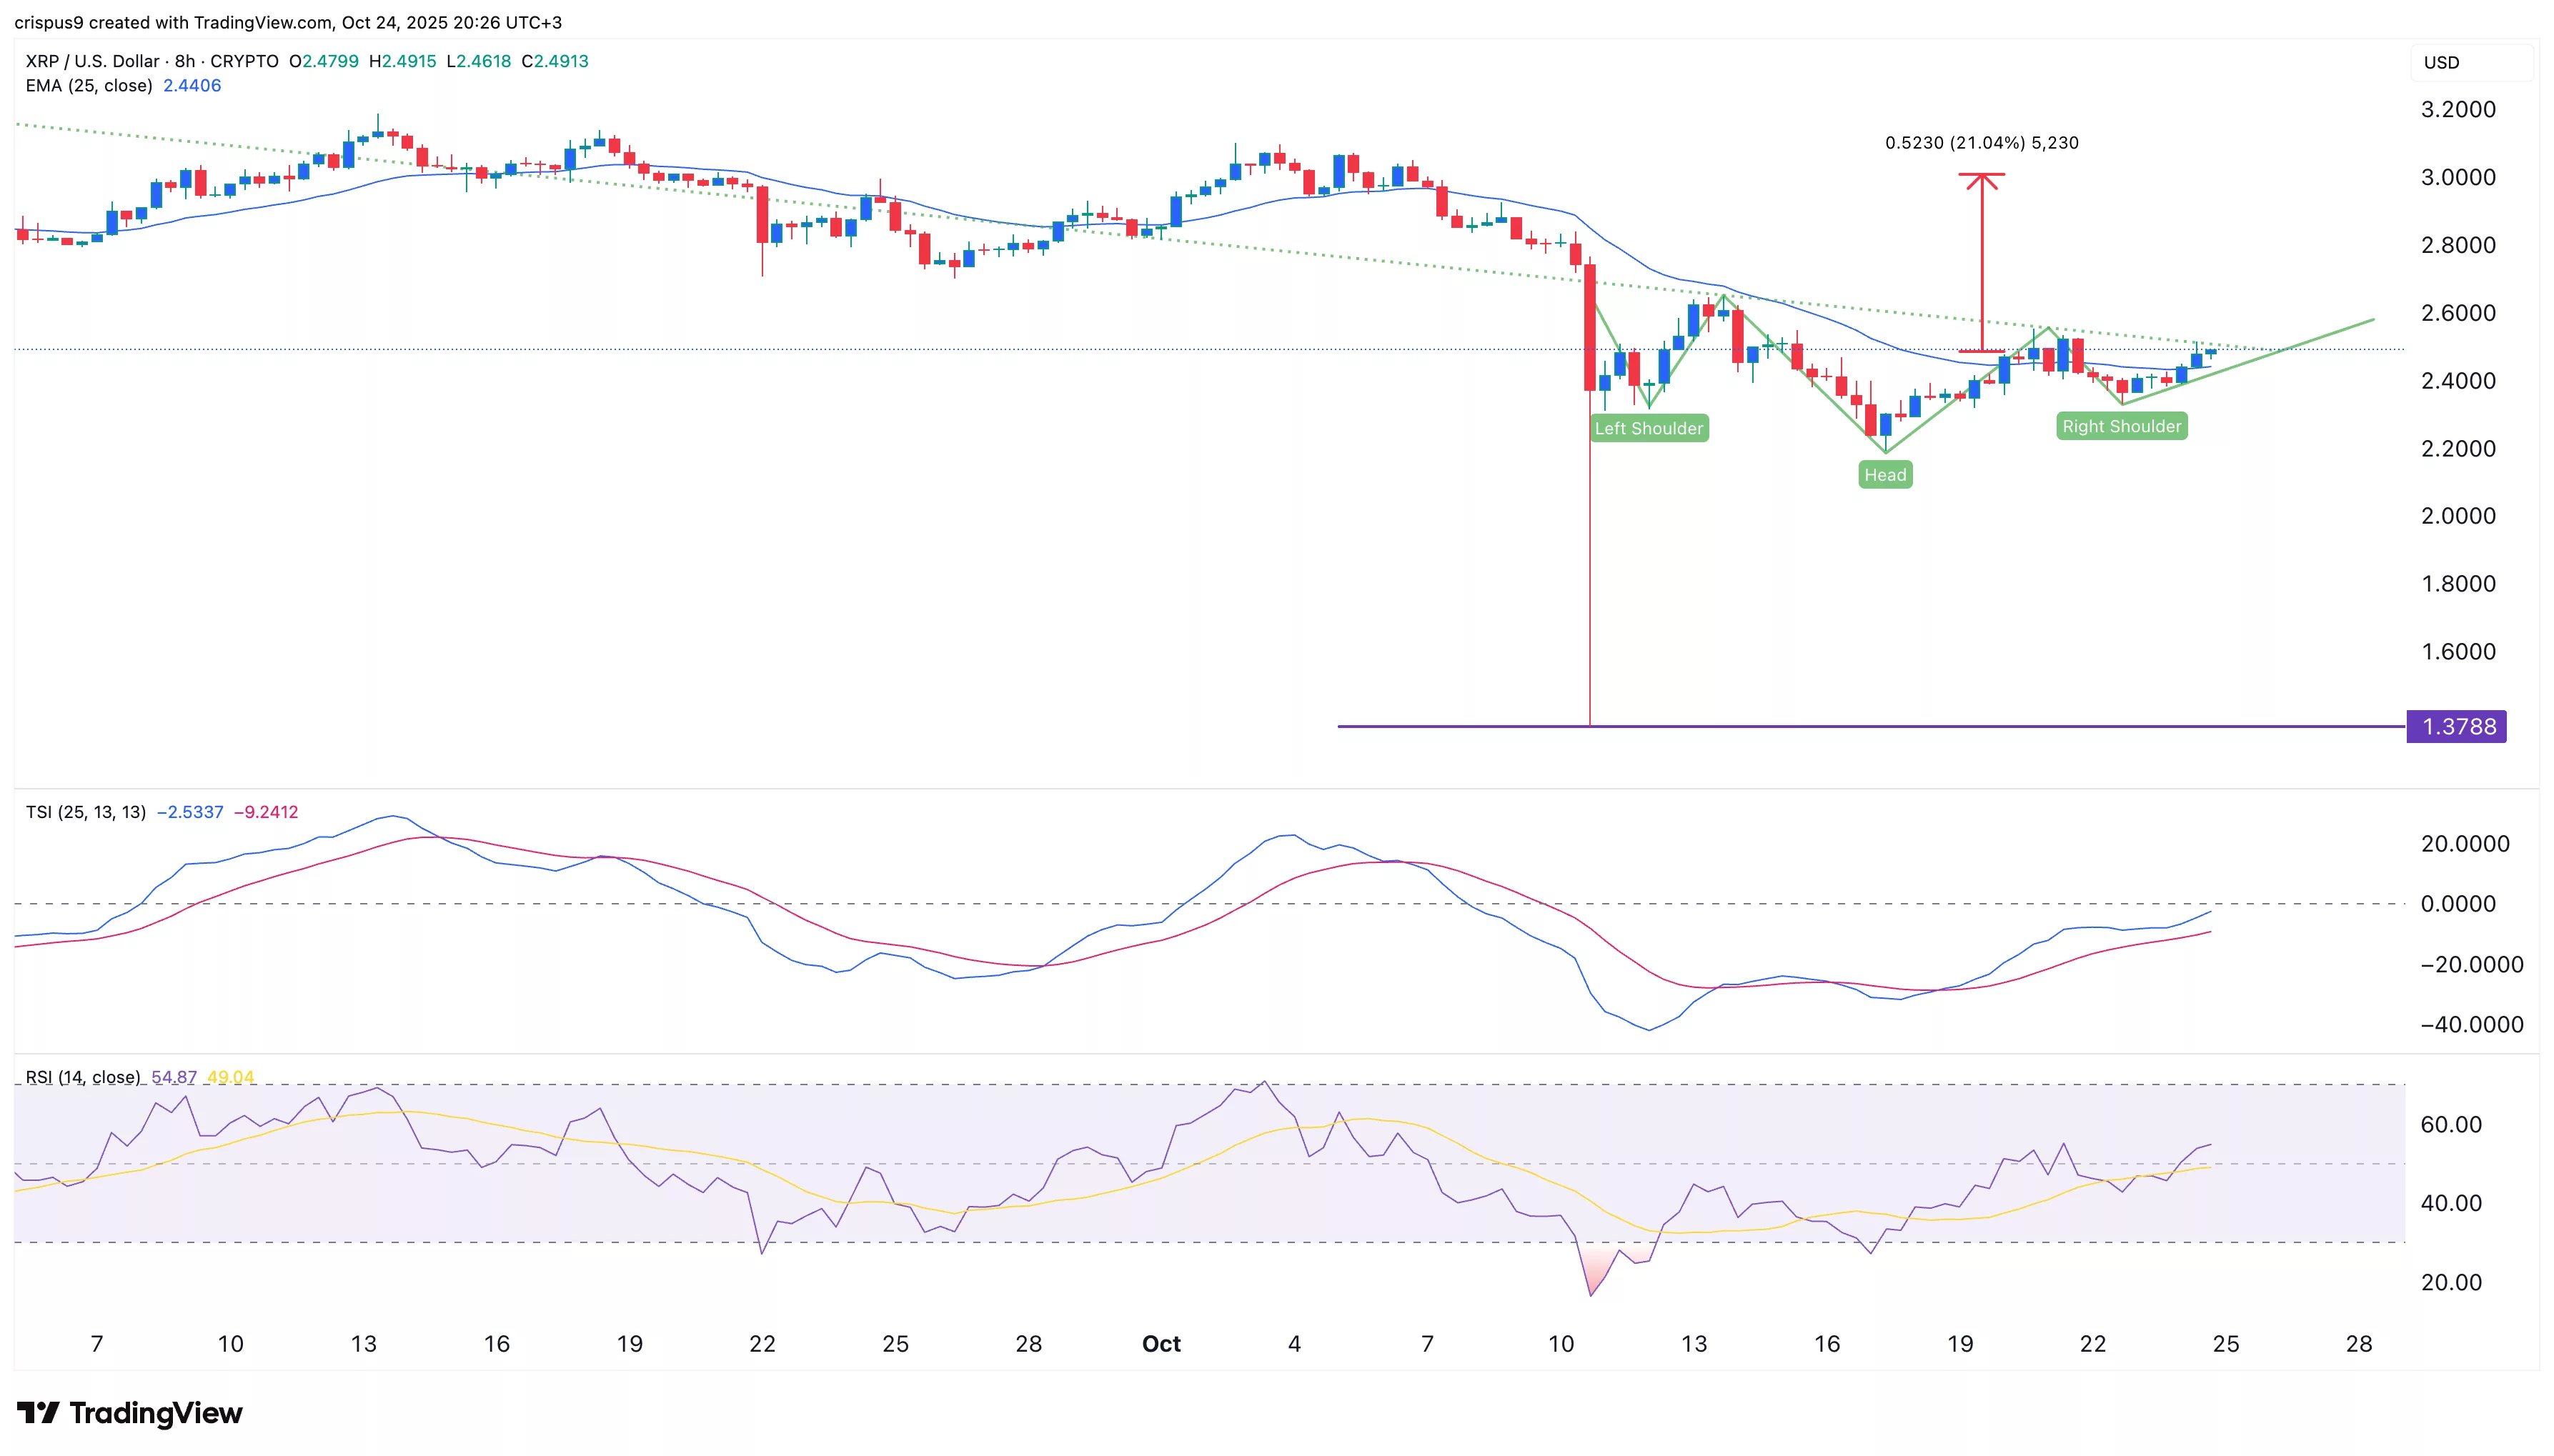
The eight-hour chart shows that the XRP price has rebounded from the year-to-date low of $1.3788 to the current $2.4840. It has crossed the 25-period Exponential Moving Average.
Most importantly, it has formed an inverse head-and-shoulder, which is shown in green above. This pattern normally leads to a strong bullish breakout over time.
Additionally, the Relative Strength Index and the True Strength Index have all pointed upwards. Therefore, the most likely scenario is where the token rebounds and hits the important resistance level at $3. This target price is about 21% above the current level.
Crypto Treasuries Chase A New Kind Of Capital
There is a peculiar irony at the heart of the crypto treasury movement. Companies that staked their futures on digital a... Read more
What Strategy's Bitcoin Sale Really Tells Us
There is a moment in every bull run when the narrative starts to fray. Not with a crash, not with a scandal, but with so... Read more
The Clock Is Ticking On UK Stablecoins
The world is not waiting for Britain to make up its mind. While the United States and the European Union have spent the ... Read more
From Cypherpunk To Citadel
How Crypto Moved from the Wild West to the Mainstream Financial SystemA long-form analysis of Bitcoin's journey from fri... Read more
Tether Plots Global Expansion
Stablecoin leader seeks to transform itself from crypto plumbing provider into a broad “freedom tech” conglomerateTe... Read more
World Liberty Seeks Federal Trust Charter
World Liberty Financial, the crypto venture backed by the Trump family, has applied for a US national bank trust charter... Read more