
XRP Price Forms A Risky Pattern As ETF Outflows Hit $40 Million

XRP price remained in a consolidation phase this week as volume in the spot market waned and exchange-traded funds suffered the biggest outflow ever.
Summary
- XRP price has formed a bearish pennant pattern on the eight-hour chart.
- This pattern points to more downside in the coming days.
- Spot XRP ETFs suffered a $40 million outflow this week.
Ripple (XRP) token was trading at $1.9172, where it has remained at in the past few days. This price remains 20% below the year-to-date high of $2.41.
SoSoValue data shows that spot XRP ETFs had their worst week since their inception in November last year.
These funds experienced over $40 million in outflows this week, bringing the cumulative inflows since their inception to $1.23 billion. It was the first time that these funds experienced weekly outflows, with 21Shares’ TOXR being the most affected.
XRP price also wavered as third-party data shows that the Ripple USD (RLUSD) stablecoin is no longer growing as it did in the past. The stablecoin has a market capitalization of $1.3 billion, a range it has remained at in the past few months.
Still, on the positive side, Binance decided to list the RLUSD stablecoin this week, making it available to millions of its customers. Also, the stablecoin will likely benefit from the upcoming expansion to other chains through a Wormhole integration.
XRP’s weakness mirrors that of other cryptocurrencies, which have remained on edge in the past few weeks. Bitcoin price has dropped to $89,000, while Ethereum has dropped below $3,000.
One reason for the weakness is that investors have rotated to the better-performing stock market, with the Dow Jones and the S&P 500 indices hovering near their all-time highs. Precious metals like gold and silver have all jumped to a record high this year.
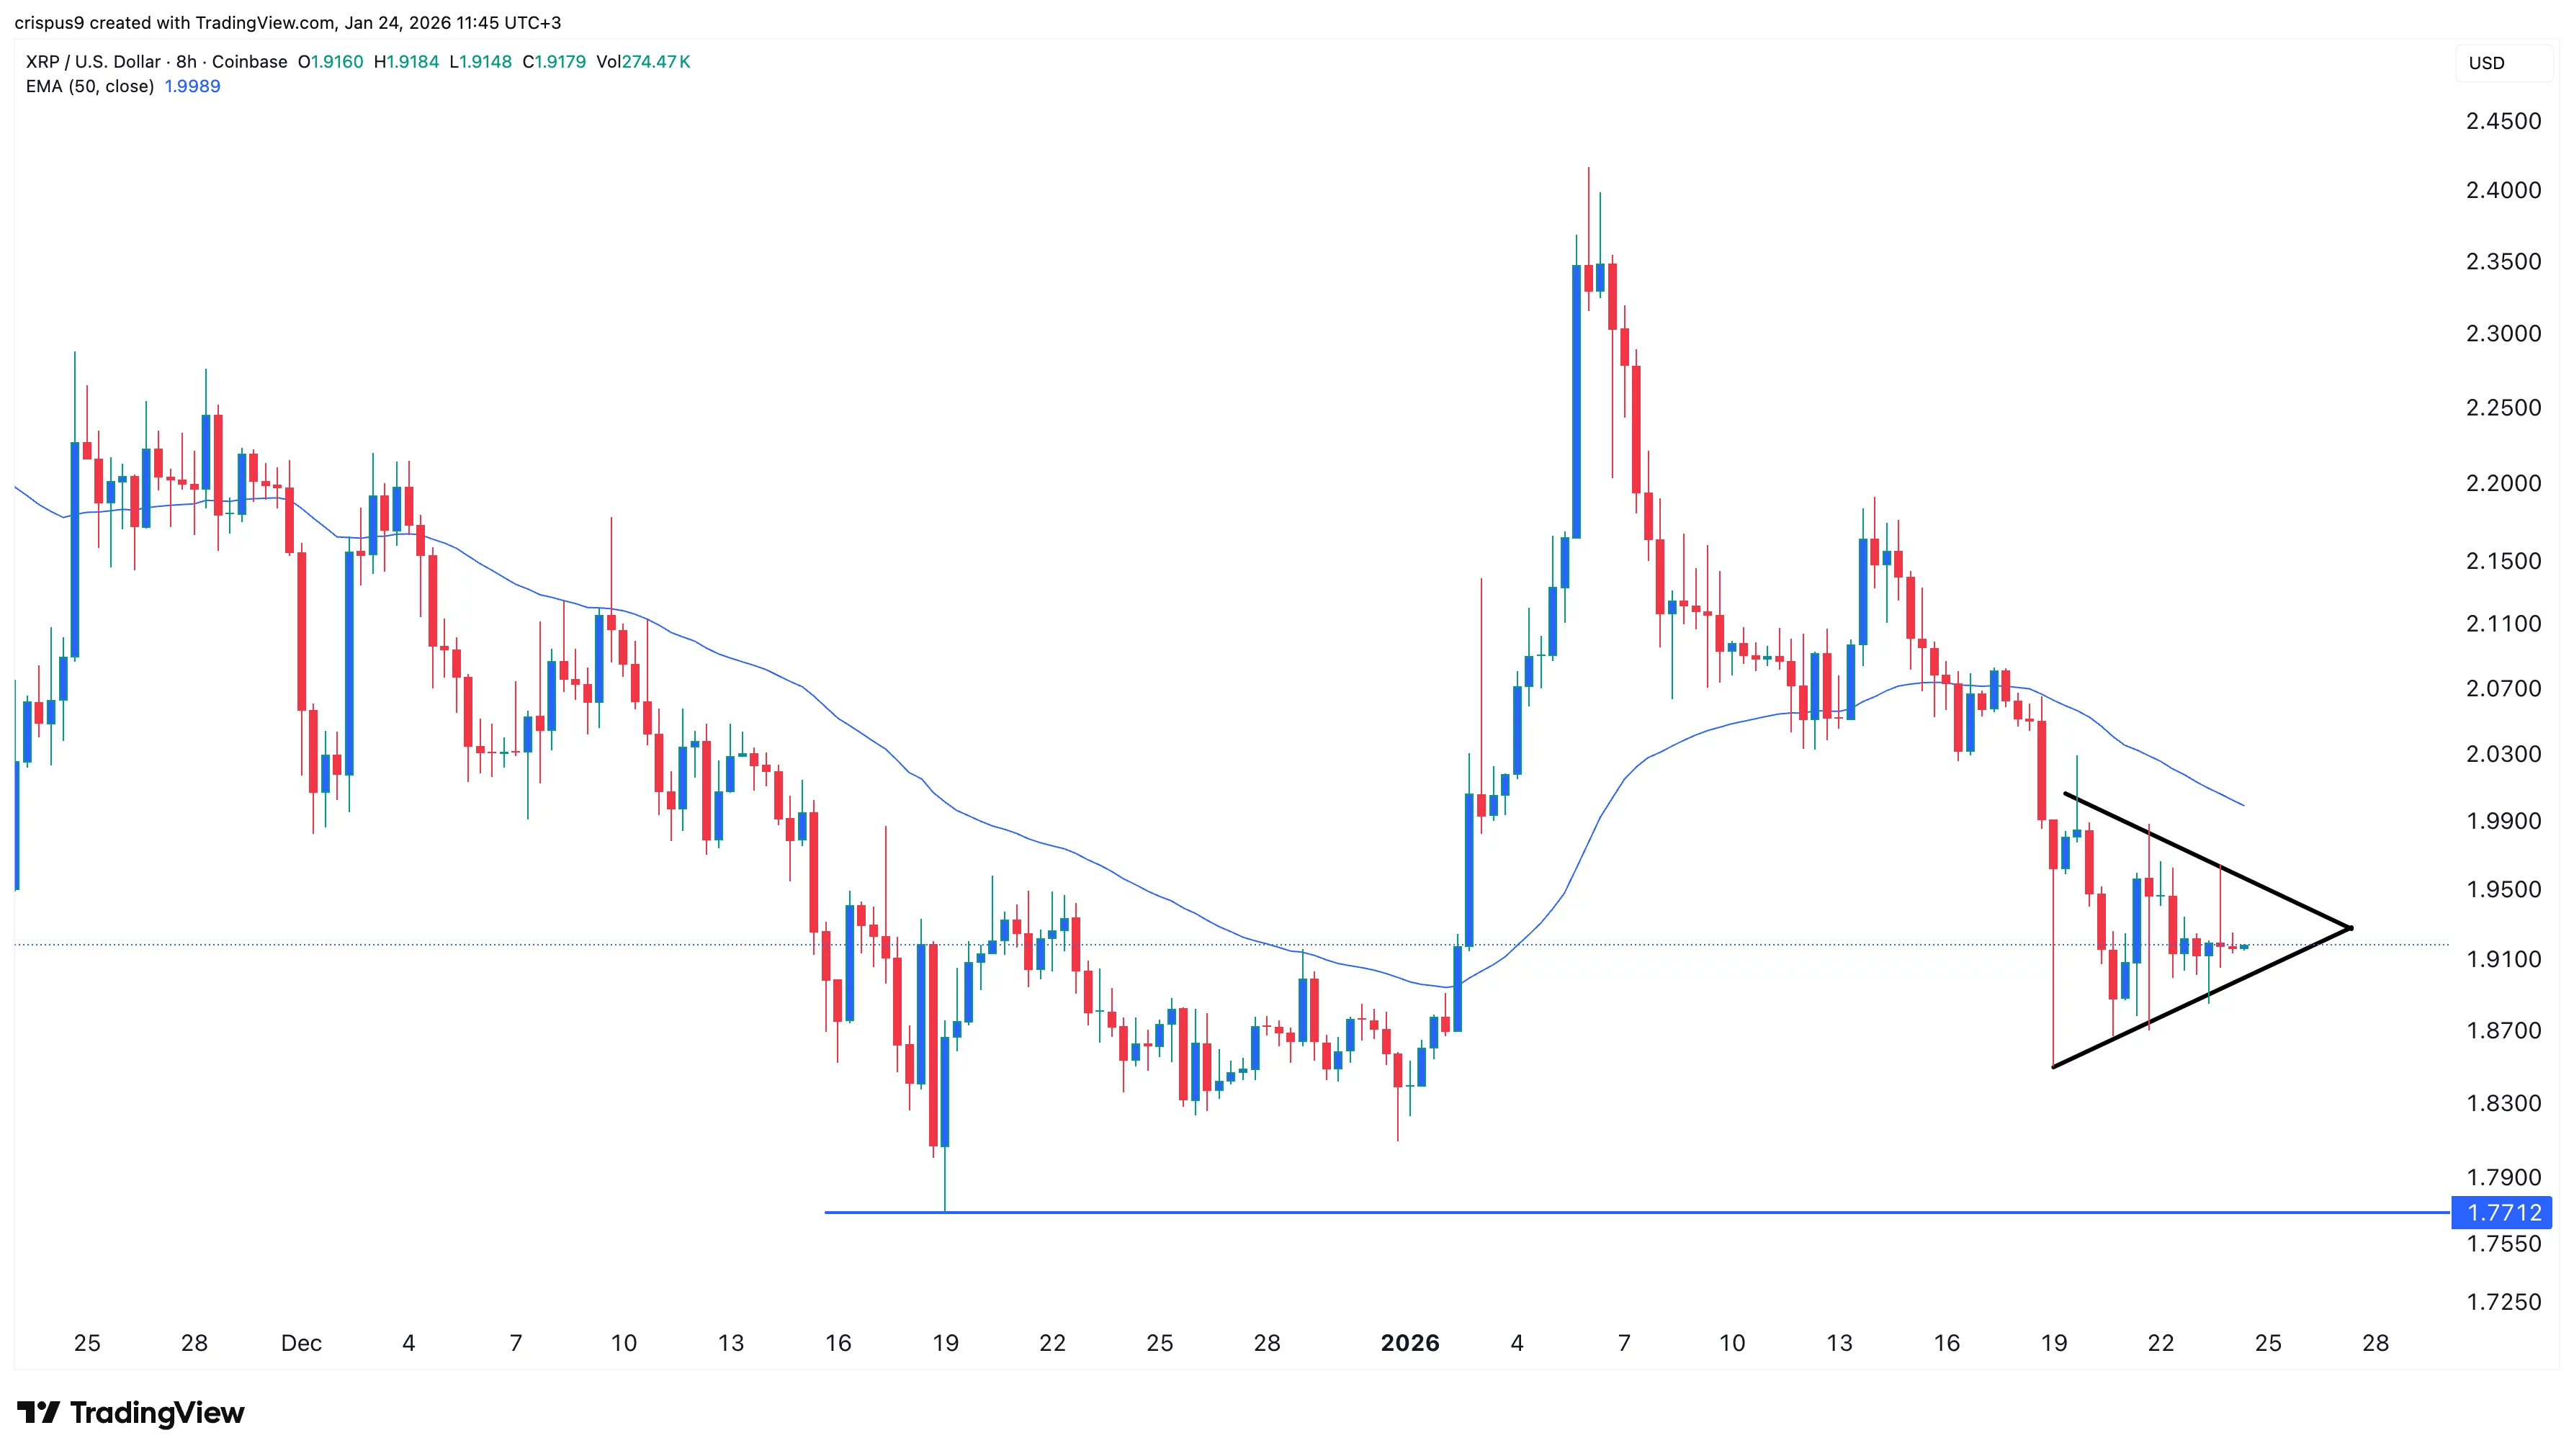
The eight-hour chart shows that the XRP price has retreated in the past few weeks, moving from a high of $2.4145 to the current $1.9175.
A closer look shows that the token has remained below the 50-period and 50-period Exponential Moving Average, a sign that bears are now in control.
The token has also formed a bearish pennant pattern, which is made up of a vertical line and a symmetrical triangle. This triangle pattern is nearing its confluence, which will lead to a bearish breakdown in the coming weeks.
Such a drop will likely see it drop to the next key support level at $1.7712, its lowest level on December 19. This target is about 7.65% below the current level.
Crypto Treasuries Chase A New Kind Of Capital
There is a peculiar irony at the heart of the crypto treasury movement. Companies that staked their futures on digital a... Read more
What Strategy's Bitcoin Sale Really Tells Us
There is a moment in every bull run when the narrative starts to fray. Not with a crash, not with a scandal, but with so... Read more
The Clock Is Ticking On UK Stablecoins
The world is not waiting for Britain to make up its mind. While the United States and the European Union have spent the ... Read more
From Cypherpunk To Citadel
How Crypto Moved from the Wild West to the Mainstream Financial SystemA long-form analysis of Bitcoin's journey from fri... Read more
Tether Plots Global Expansion
Stablecoin leader seeks to transform itself from crypto plumbing provider into a broad “freedom tech” conglomerateTe... Read more
World Liberty Seeks Federal Trust Charter
World Liberty Financial, the crypto venture backed by the Trump family, has applied for a US national bank trust charter... Read more