
XRP Price Flags A Bullish Hammer Candle As Liquidations Jump

The XRP price crashed to the lowest level since April last year as the crypto market plunged and liquidations accelerated.
Summary
- XRP price crashed to its lowest level since April last year.
- It has formed a hammer candlestick pattern, a common bullish reversal sign.
- The coin will likely have a short-term rebound in the near term.
Ripple (XRP) token dropped to a low of $1.5000, down by 55% from its highest point in 2025, a plunge that has cost investors billions of dollars.
The token crash coincided with the ongoing crypto market crash that has affected the market. Bitcoin dropped below the key support level at $80,000, while most tokens have now plunged by over 50% from their all-time highs.
XRP has crashed as many investors have started selling, and buyers have remained on the sidelines. The same is happening in the ETF market, where the spot XRP funds shed over $52 million last week and $40 million a week before that. These funds have now had over $1.18 billion in cumulative inflows.
XRP price also crashed as liquidations jumped. Data compiled by CoinGlass shows that the total liquidations in the crypto industry jumped by 357% in the last 24 hours to over $2.58 billion.
Ethereum liquidations jumped to over $1.15 billion, while Bitcoin positions worth $785 million were wiped out. XRP positions worth over $61 million were liquidated in the last 24 hours.
XRP price also crashed as investors remained highly fearful. Data shows that the Crypto Fear and Greed Index crashed to the extreme fear zone of 18. In most cases, cryptocurrencies normally drop when there is robust fear in the industry.
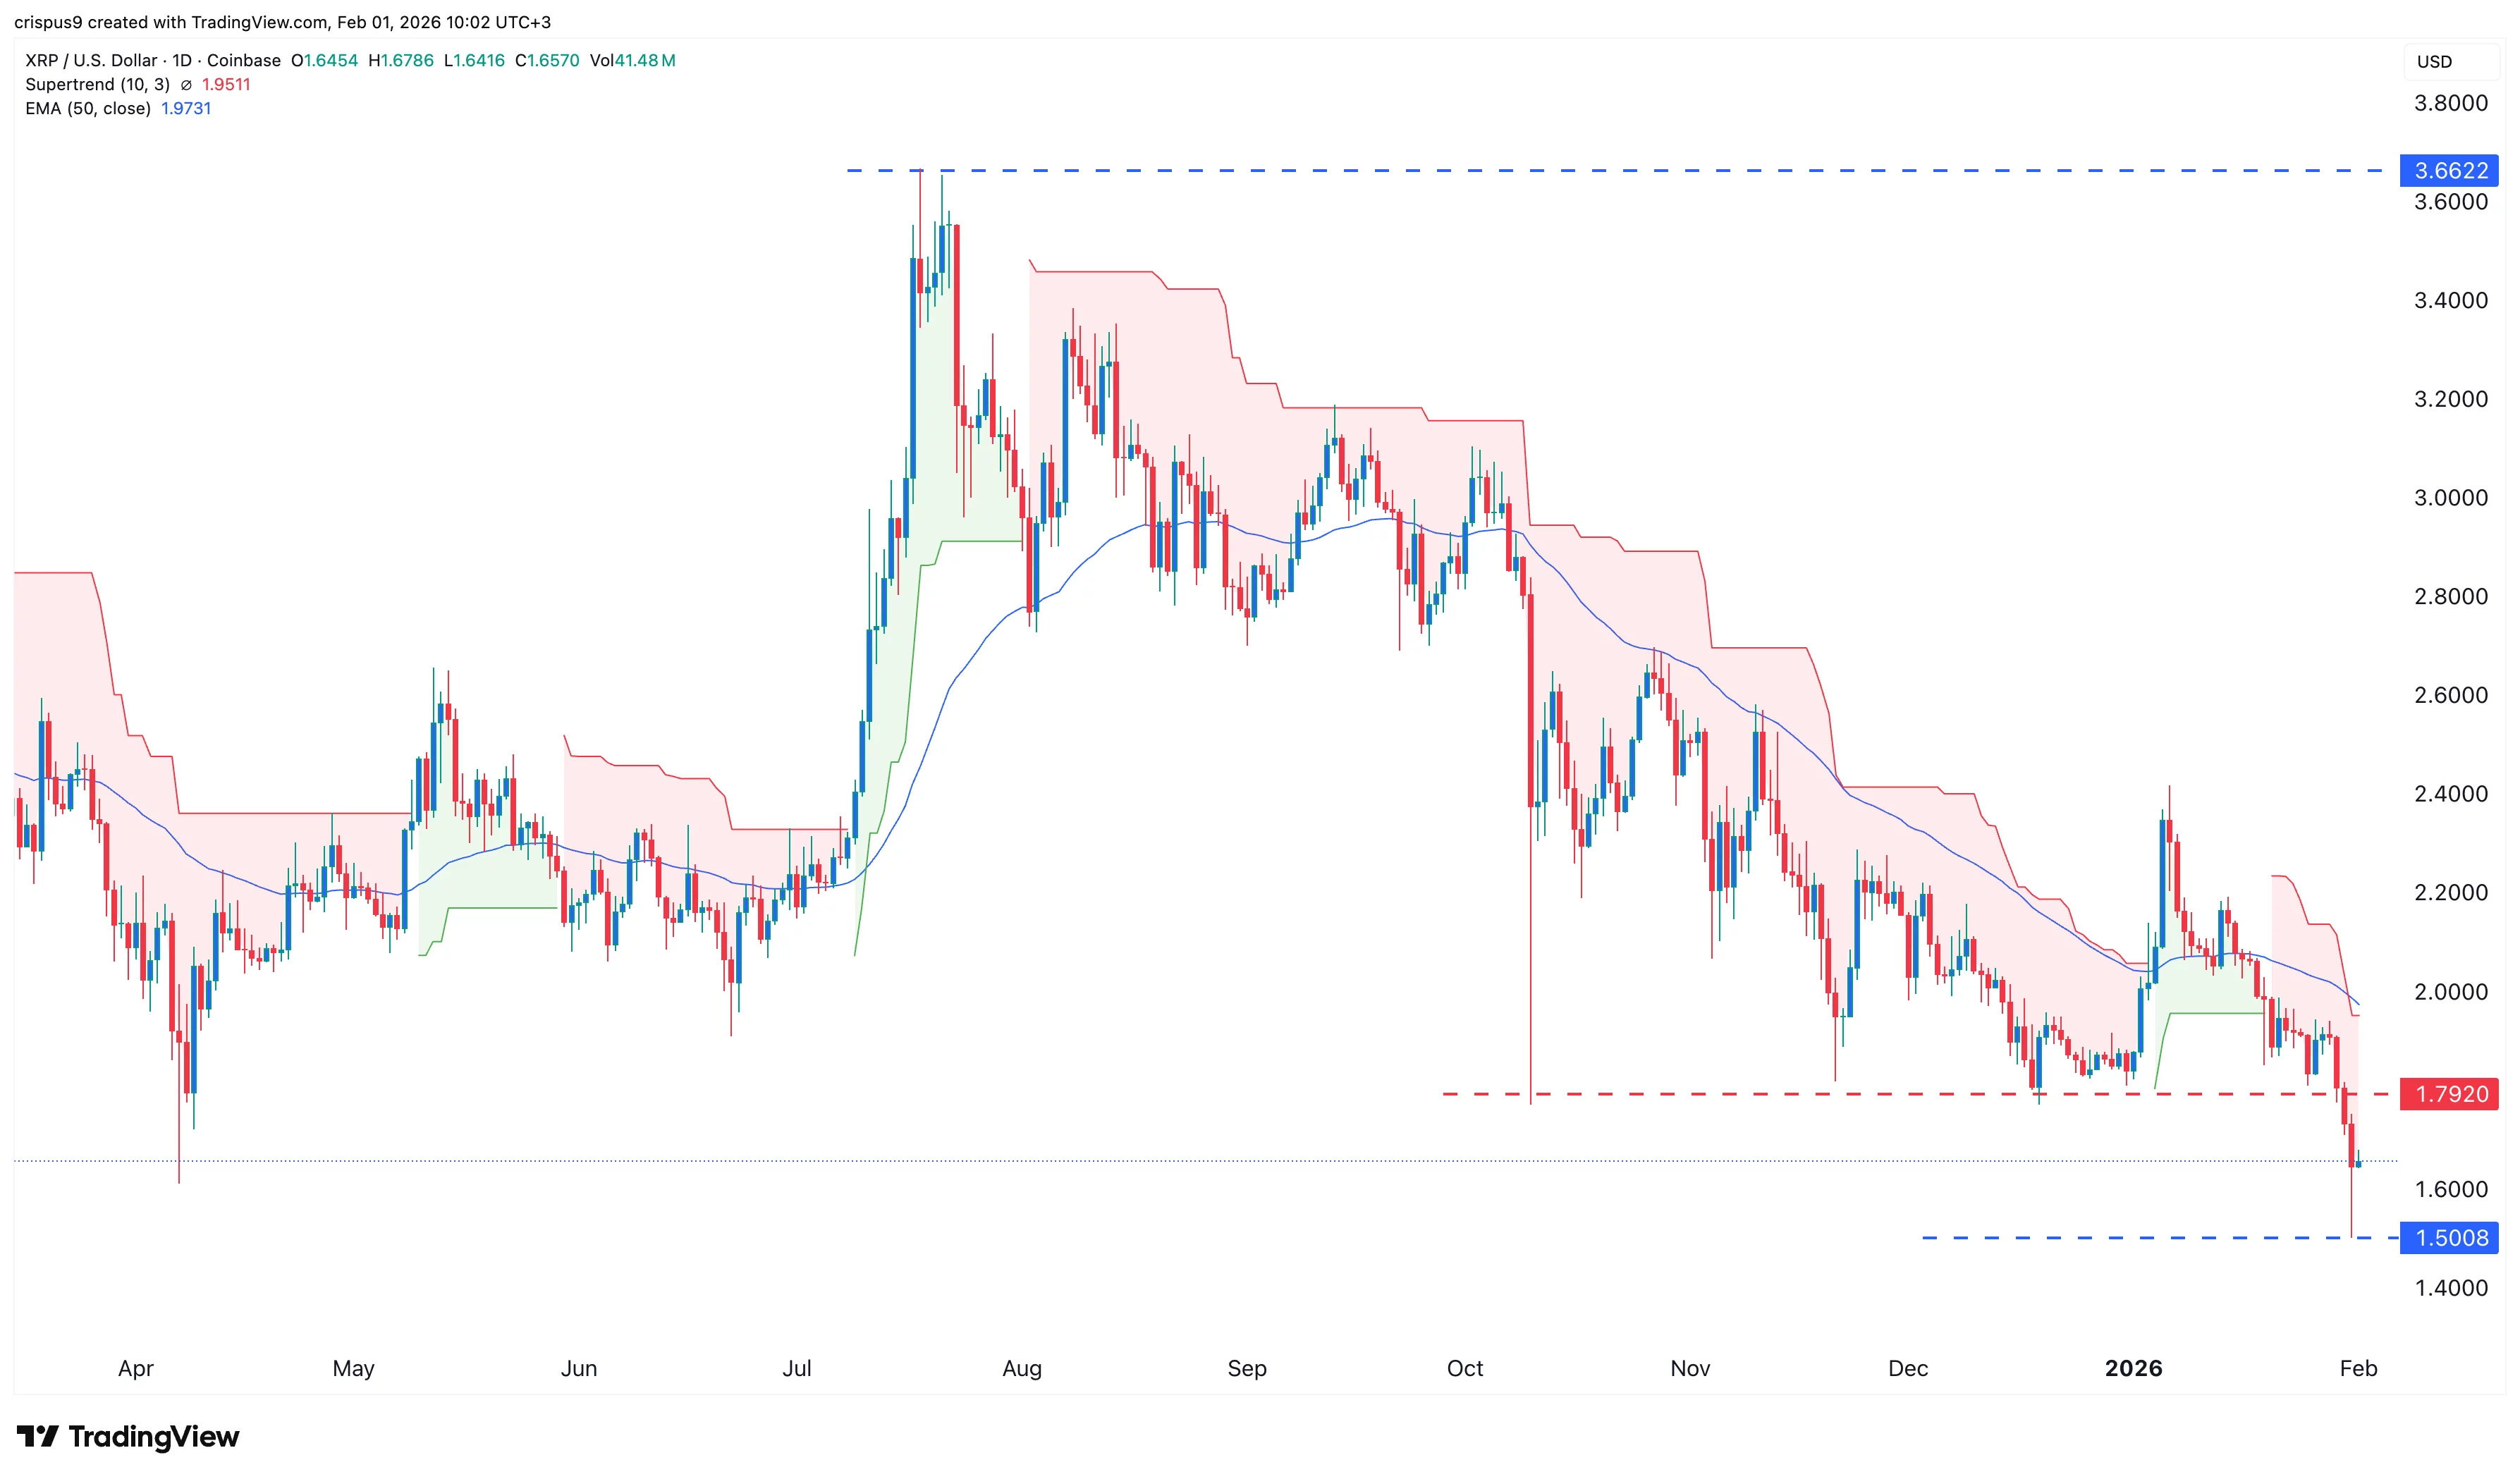
The daily timeframe chart shows that the XRP price has crashed in the past few months, moving from a high of $3.6622 in July last year to a low of $1.500.
It crashed below the important support level at $1.7920, its lowest level in October, November, and December last year. A drop below that level is a sign the bears have prevailed.
The token remains below all moving averages and the Supertrend indicator. On the positive side, it has formed a hammer candlestick pattern, which consists of a long lower shadow and a small body.
A hammer is a common bullish reversal sign. Therefore, the Ripple price will likely resume the uptrend and potentially reach a high of $1.7920, up by 9% above the current level.
Such a rebound will be a break-and-retest pattern, which is a common bearish continuation sign. A complete rebound will be confirmed if it moves above the 50-day moving average and the Supertrend indicator.
Crypto Treasuries Chase A New Kind Of Capital
There is a peculiar irony at the heart of the crypto treasury movement. Companies that staked their futures on digital a... Read more
What Strategy's Bitcoin Sale Really Tells Us
There is a moment in every bull run when the narrative starts to fray. Not with a crash, not with a scandal, but with so... Read more
The Clock Is Ticking On UK Stablecoins
The world is not waiting for Britain to make up its mind. While the United States and the European Union have spent the ... Read more
From Cypherpunk To Citadel
How Crypto Moved from the Wild West to the Mainstream Financial SystemA long-form analysis of Bitcoin's journey from fri... Read more
Tether Plots Global Expansion
Stablecoin leader seeks to transform itself from crypto plumbing provider into a broad “freedom tech” conglomerateTe... Read more
World Liberty Seeks Federal Trust Charter
World Liberty Financial, the crypto venture backed by the Trump family, has applied for a US national bank trust charter... Read more