
XRP Price Falls Despite $71m Surge Into Spot Ripple ETF

XRP price remained in a bear market this week after falling by 25% from the year-to-date high despite a surge in ETF inflows.
Summary
- XRP price crashed to a crucial support level as ETF inflows jumped.
- The recently launched XRP ETF has had over $71 million in inflows.
- Technical analysis points to a strong rebound in the near term.
Spot XRPR ETF inflows soar
The Ripple (XRP) token was trading at $2.77 on September 27, down from the all-time high of $3.65.
The XRP price crash mirrored the performance of other cryptocurrencies, such as Ethereum and Bitcoin. This decline was attributed to rising Federal Reserve jitters and soaring liquidations in the cryptocurrency market.
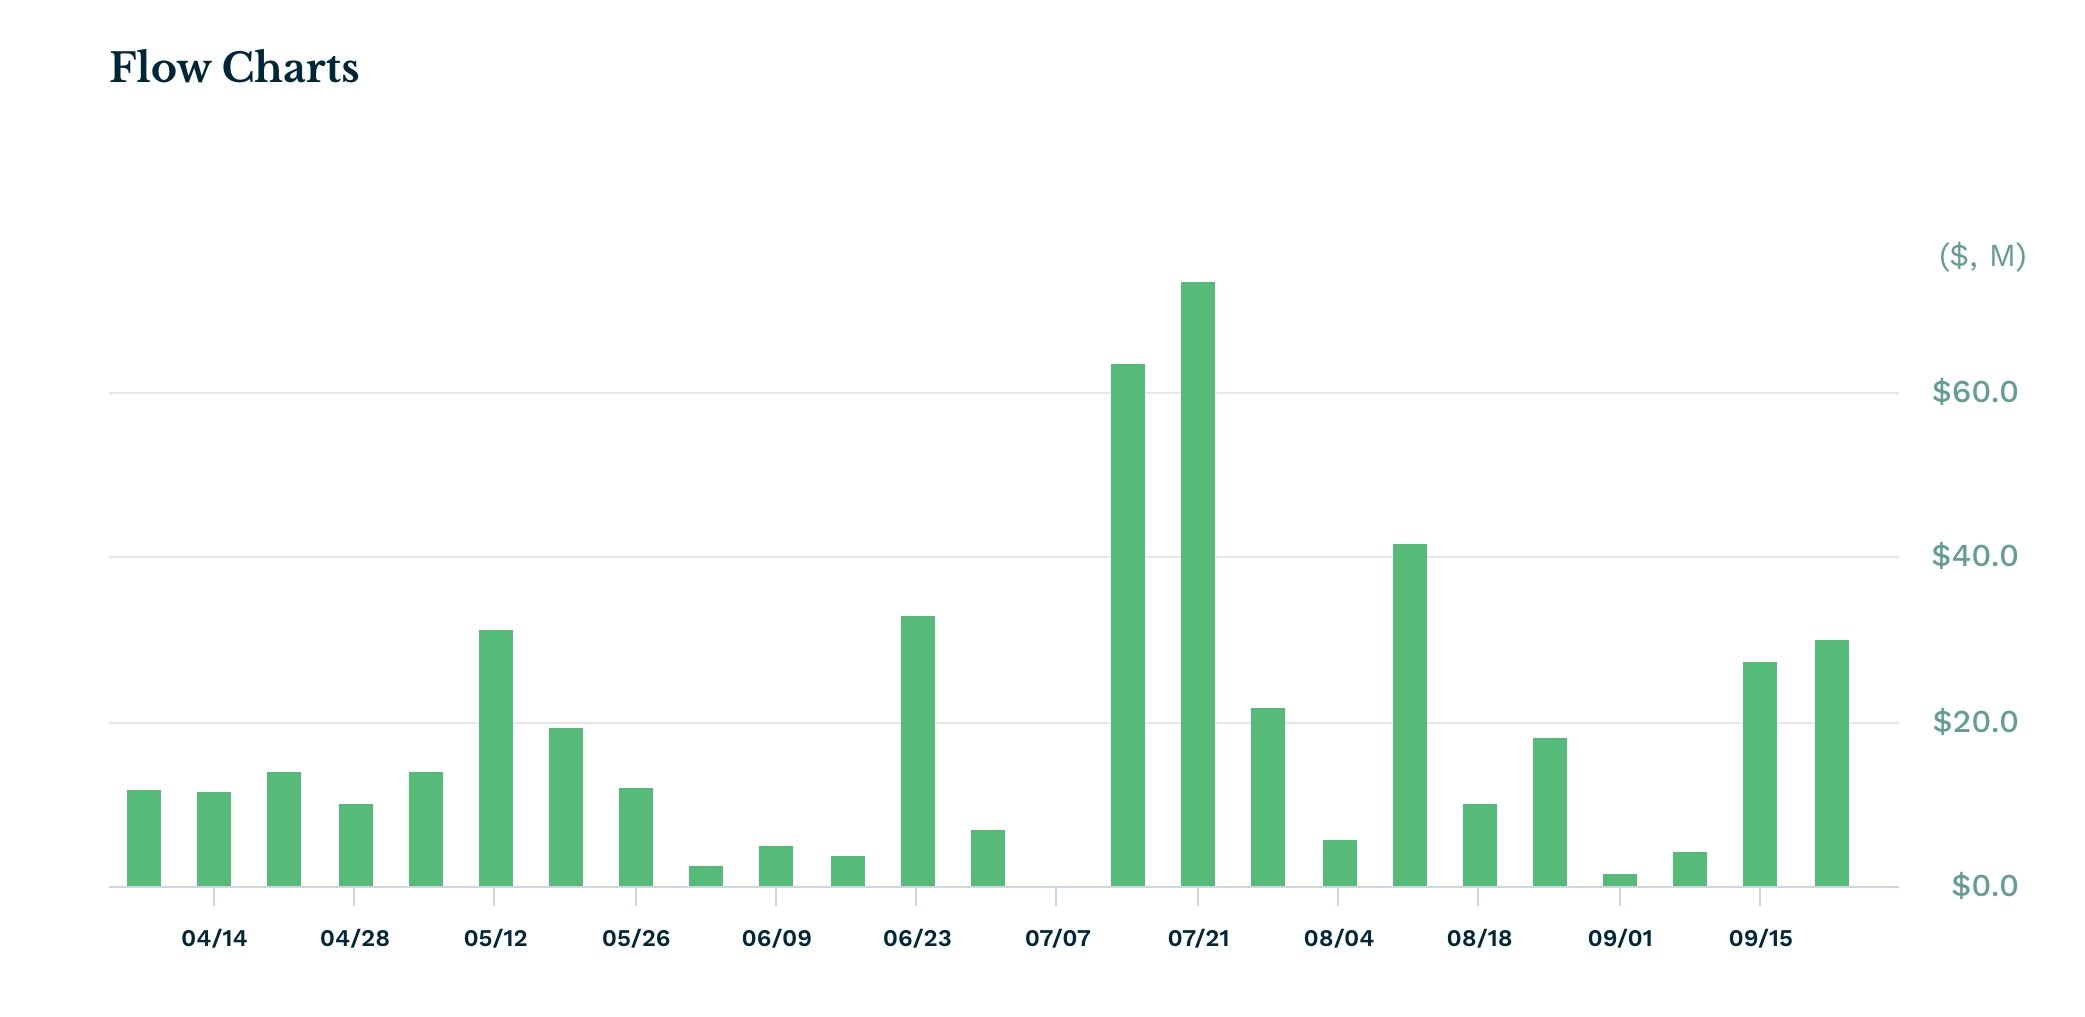
On the positive side, there is robust demand for the recently-launched spot XRP ETF. Data compiled by ETF.com shows that the ETF has had over $71 million in inflows since its inception last week.
Most of these inflows occurred on Thursday, when they increased by over $36 million. The fund now has over $66 million, a substantial amount for an ETF launched by a relatively small fund manager, with an expense ratio of 0.75%.
Other XRP-linked ETFs have also had strong inflows this year. For example, the Teucrium 2x XRP ETF (XXRP) has had inflows in each week since its inception, bringing its assets under management to $383 million.
These numbers indicate a strong demand for XRP assets on Wall Street. They also mean that the spot XRP ETFs offered by companies like Franklin Templeton and Invesco will experience robust inflows due to their lower fees.
Analysts at JPMorgan predict that these funds will have over $8 billion in inflows in the first year.
XRP price technical analysis
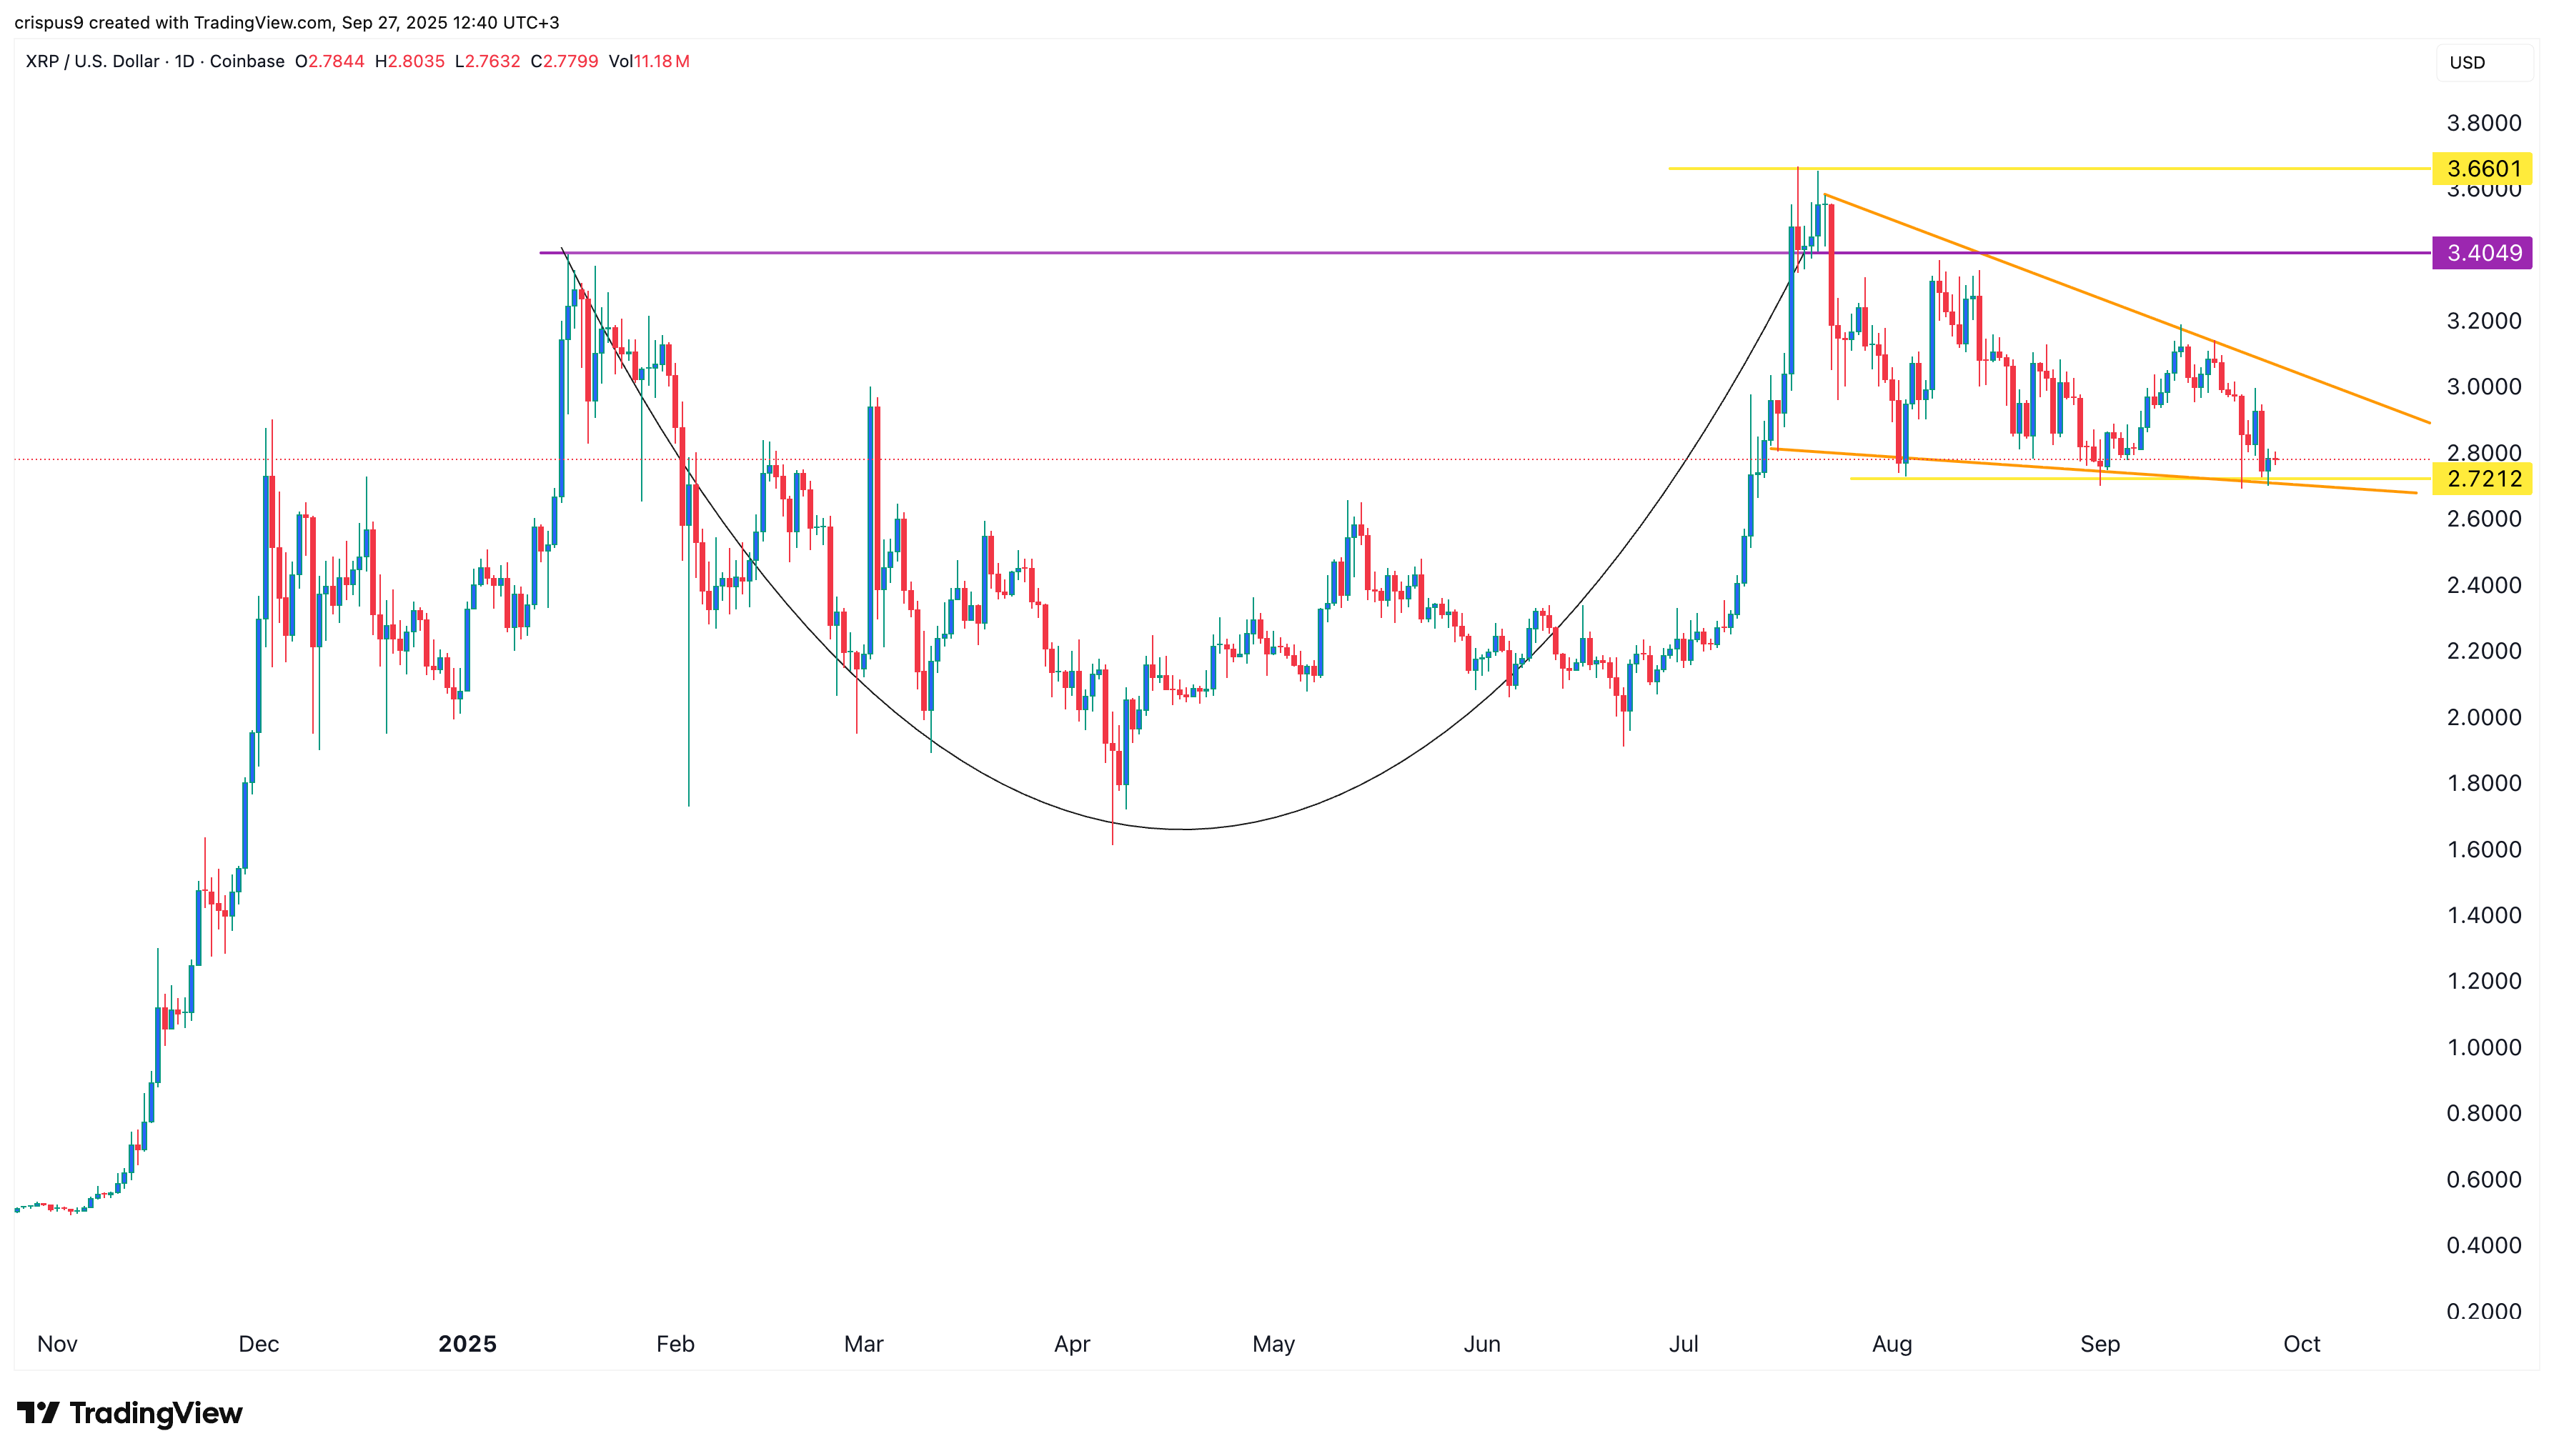
The daily chart shows that the XRP token has formed numerous bullish patterns. For example, it has formed a triple-bottom pattern at $2.7212. A triple-bottom often leads to a strong bullish breakout.
The coin has also formed a falling wedge pattern, which is made up of two descending and converging trendlines. This pattern is also part of the handle section of the cup-and-handle pattern.
At the same time, it is in the second phase of the Elliot Wave pattern. Therefore, the coin is likely to experience a strong bullish breakout, potentially reaching the year-to-date high of $3.660.
Crypto Treasuries Chase A New Kind Of Capital
There is a peculiar irony at the heart of the crypto treasury movement. Companies that staked their futures on digital a... Read more
What Strategy's Bitcoin Sale Really Tells Us
There is a moment in every bull run when the narrative starts to fray. Not with a crash, not with a scandal, but with so... Read more
The Clock Is Ticking On UK Stablecoins
The world is not waiting for Britain to make up its mind. While the United States and the European Union have spent the ... Read more
From Cypherpunk To Citadel
How Crypto Moved from the Wild West to the Mainstream Financial SystemA long-form analysis of Bitcoin's journey from fri... Read more
Tether Plots Global Expansion
Stablecoin leader seeks to transform itself from crypto plumbing provider into a broad “freedom tech” conglomerateTe... Read more
World Liberty Seeks Federal Trust Charter
World Liberty Financial, the crypto venture backed by the Trump family, has applied for a US national bank trust charter... Read more