
Ripple Price Risks $2 Crash As XRP ETF Launch Nears

Ripple price remained on edge and formed at least two risky patterns pointing to a crash despite renewed hopes that spot XRP ETFs will launch soon.
Summary
- Ripple price has formed a death cross pattern on the daily chart.
- It also formed a break-and-retest pattern by touching the lower side of the descending triangle.
- These patterns point to a crash when the XRP ETF approval happens.
XRP ETFs are nearing their launch
Ripple (XRP) token was trading at an important support at $2.50, down by over 30% from its highest point this year. Its crash has coincided with the ongoing weakness in the crypto market.
The ongoing XRP price action is happening as the exchange-traded funds approval date nears.
One sign that these funds will be approved soon is that Bitwise updated their filing on Friday to include the listing on the NYSE and its fees, which will be 0.34%. According to Bloomberg’s Eric Balchunas, this is usually the last stage before an ETF starts trading.
Another sign that the SEC will give its go-ahead for spot XRP ETFs is that it has already allowed other spot altcoin funds. The recently launched Litecoin ETF has had over $700k in inflows, while the HBAR fund had $44.39 million.
Solana ETFs are nearing $200 million in inflows, making them the most successful launches. They hold over $502 million in assets, equivalent to 0.49% of the market cap.
XRP ETFs will likely have higher inflows than Solana. One sign for this is that the recently-launched REX-Osprey XRP ETF, which has an expense ratio of 0.75% has gained over $110 million in assets in its first month. Also, JPMorgan analysts estimate that XRP ETFs will have over $8 billion in inflows in the first year.
In theory, the Ripple ETFs approval should boost the token’s price as it will bring new money to XRP. However, in the near term, the token may drop as investors sell the news, as we saw with Solana and Hedera.
Ripple price technical analysis
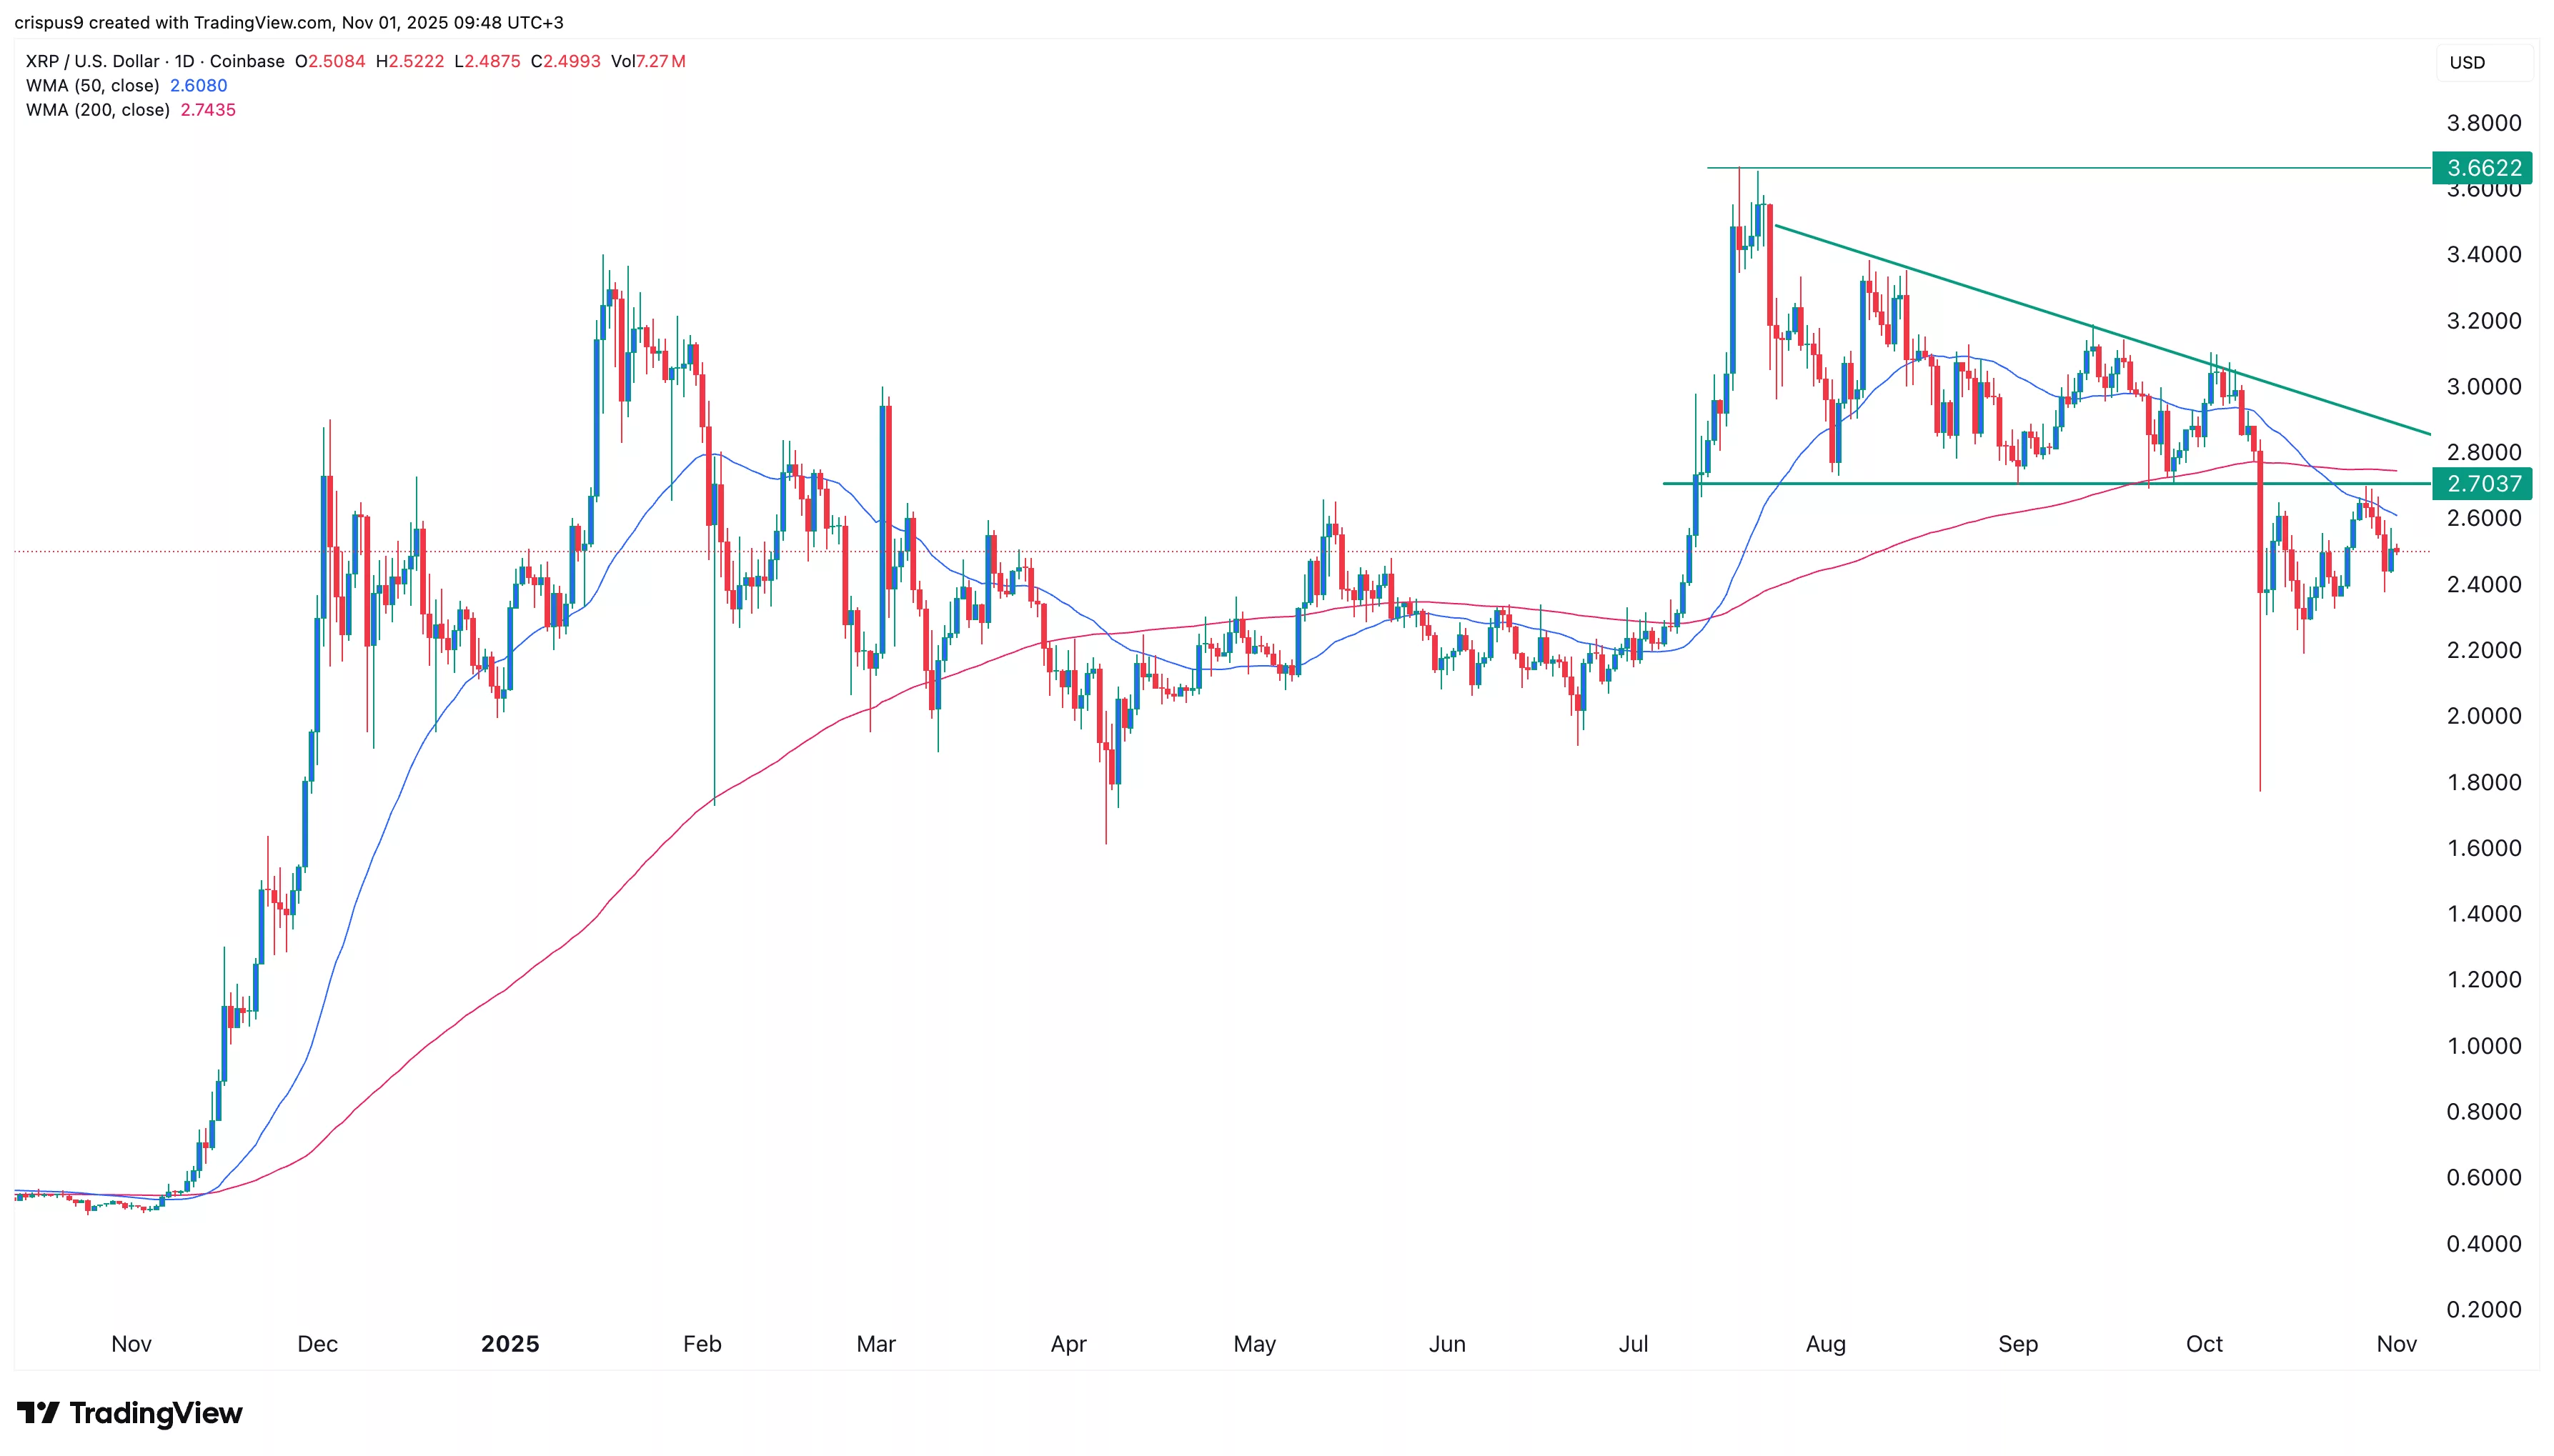
The daily chart shows that the XRP price has dropped in the past few months. This crash started after it jumped to a record high of $3.66 in August and intensified in October.
The token formed a death cross pattern on Oct. 18 as the 200-day and 50-day Weighted Moving Averages crossed each other. It also moved below the key support at $2.70 on Oct. 11. This was a notable level as it was the lower side of the descending triangle pattern.
Most notably, the coin rebounded and retested this price last week, concluding a break-and-retest pattern. Therefore, a combination of a death cross, descending triangle, and a break-and-retest pattern points to more downside, potentially to $2.
Crypto Treasuries Chase A New Kind Of Capital
There is a peculiar irony at the heart of the crypto treasury movement. Companies that staked their futures on digital a... Read more
What Strategy's Bitcoin Sale Really Tells Us
There is a moment in every bull run when the narrative starts to fray. Not with a crash, not with a scandal, but with so... Read more
The Clock Is Ticking On UK Stablecoins
The world is not waiting for Britain to make up its mind. While the United States and the European Union have spent the ... Read more
From Cypherpunk To Citadel
How Crypto Moved from the Wild West to the Mainstream Financial SystemA long-form analysis of Bitcoin's journey from fri... Read more
Tether Plots Global Expansion
Stablecoin leader seeks to transform itself from crypto plumbing provider into a broad “freedom tech” conglomerateTe... Read more
World Liberty Seeks Federal Trust Charter
World Liberty Financial, the crypto venture backed by the Trump family, has applied for a US national bank trust charter... Read more