
Red Alert: Ethereum Price Is Slowly Forming A Risky Pattern

Ethereum price has remained on edge in the past few months, moving from the year-to-date high of $4,945 in August to the current $3,412.
Summary
- Ethereum price is slowly forming a death cross pattern on the daily chart.
- It is also forming a bearish pennant pattern as its weakness persists.
- Ethereum ETF outflows have continued in the past few weeks
Ethereum (ETH) token has pulled back as sentiment in the industry has waned, with the Crypto Fear and Greed Index moving to the fear zone of 25.
It has dropped as investors have continued to pare back their positions in the past few months. Data shows that Ethereum ETF inflows have slowed, a sign that demand is waning after the large liquidation in October.
Spot Ethereum ETFs shed over $507 million last week after adding $15.7 million a week earlier. Before that, they had net outflows in the previous two consecutive weeks. As a result, the cumulative net outflow has moved from nearly $15 billion earlier this year to $13.86 billion.
Ethereum price has also plunged as investors have reduced their use of leverage. The futures open interest has been on a strong downtrend, moving from a peak of $70 billion in August to a low of $39 billion today.
The weakness in the futures market is notable because it is one of the most active in the crypto industry. Most notably, volume in the spot market has also continued falling in the past few months.
Ethereum is also struggling as cracks start to emerge among treasury companies. Top Ethereum treasury stocks like BitMine, SharpLink, and ETHZilla have all plunged recently.
ETHZilla has even sold some of its Ethereum holdings in a bid to boost its stock through buybacks. With the NAV multiples falling, there is a risk that either ETH buying will slow or some of the companies will start to sell their tokens.
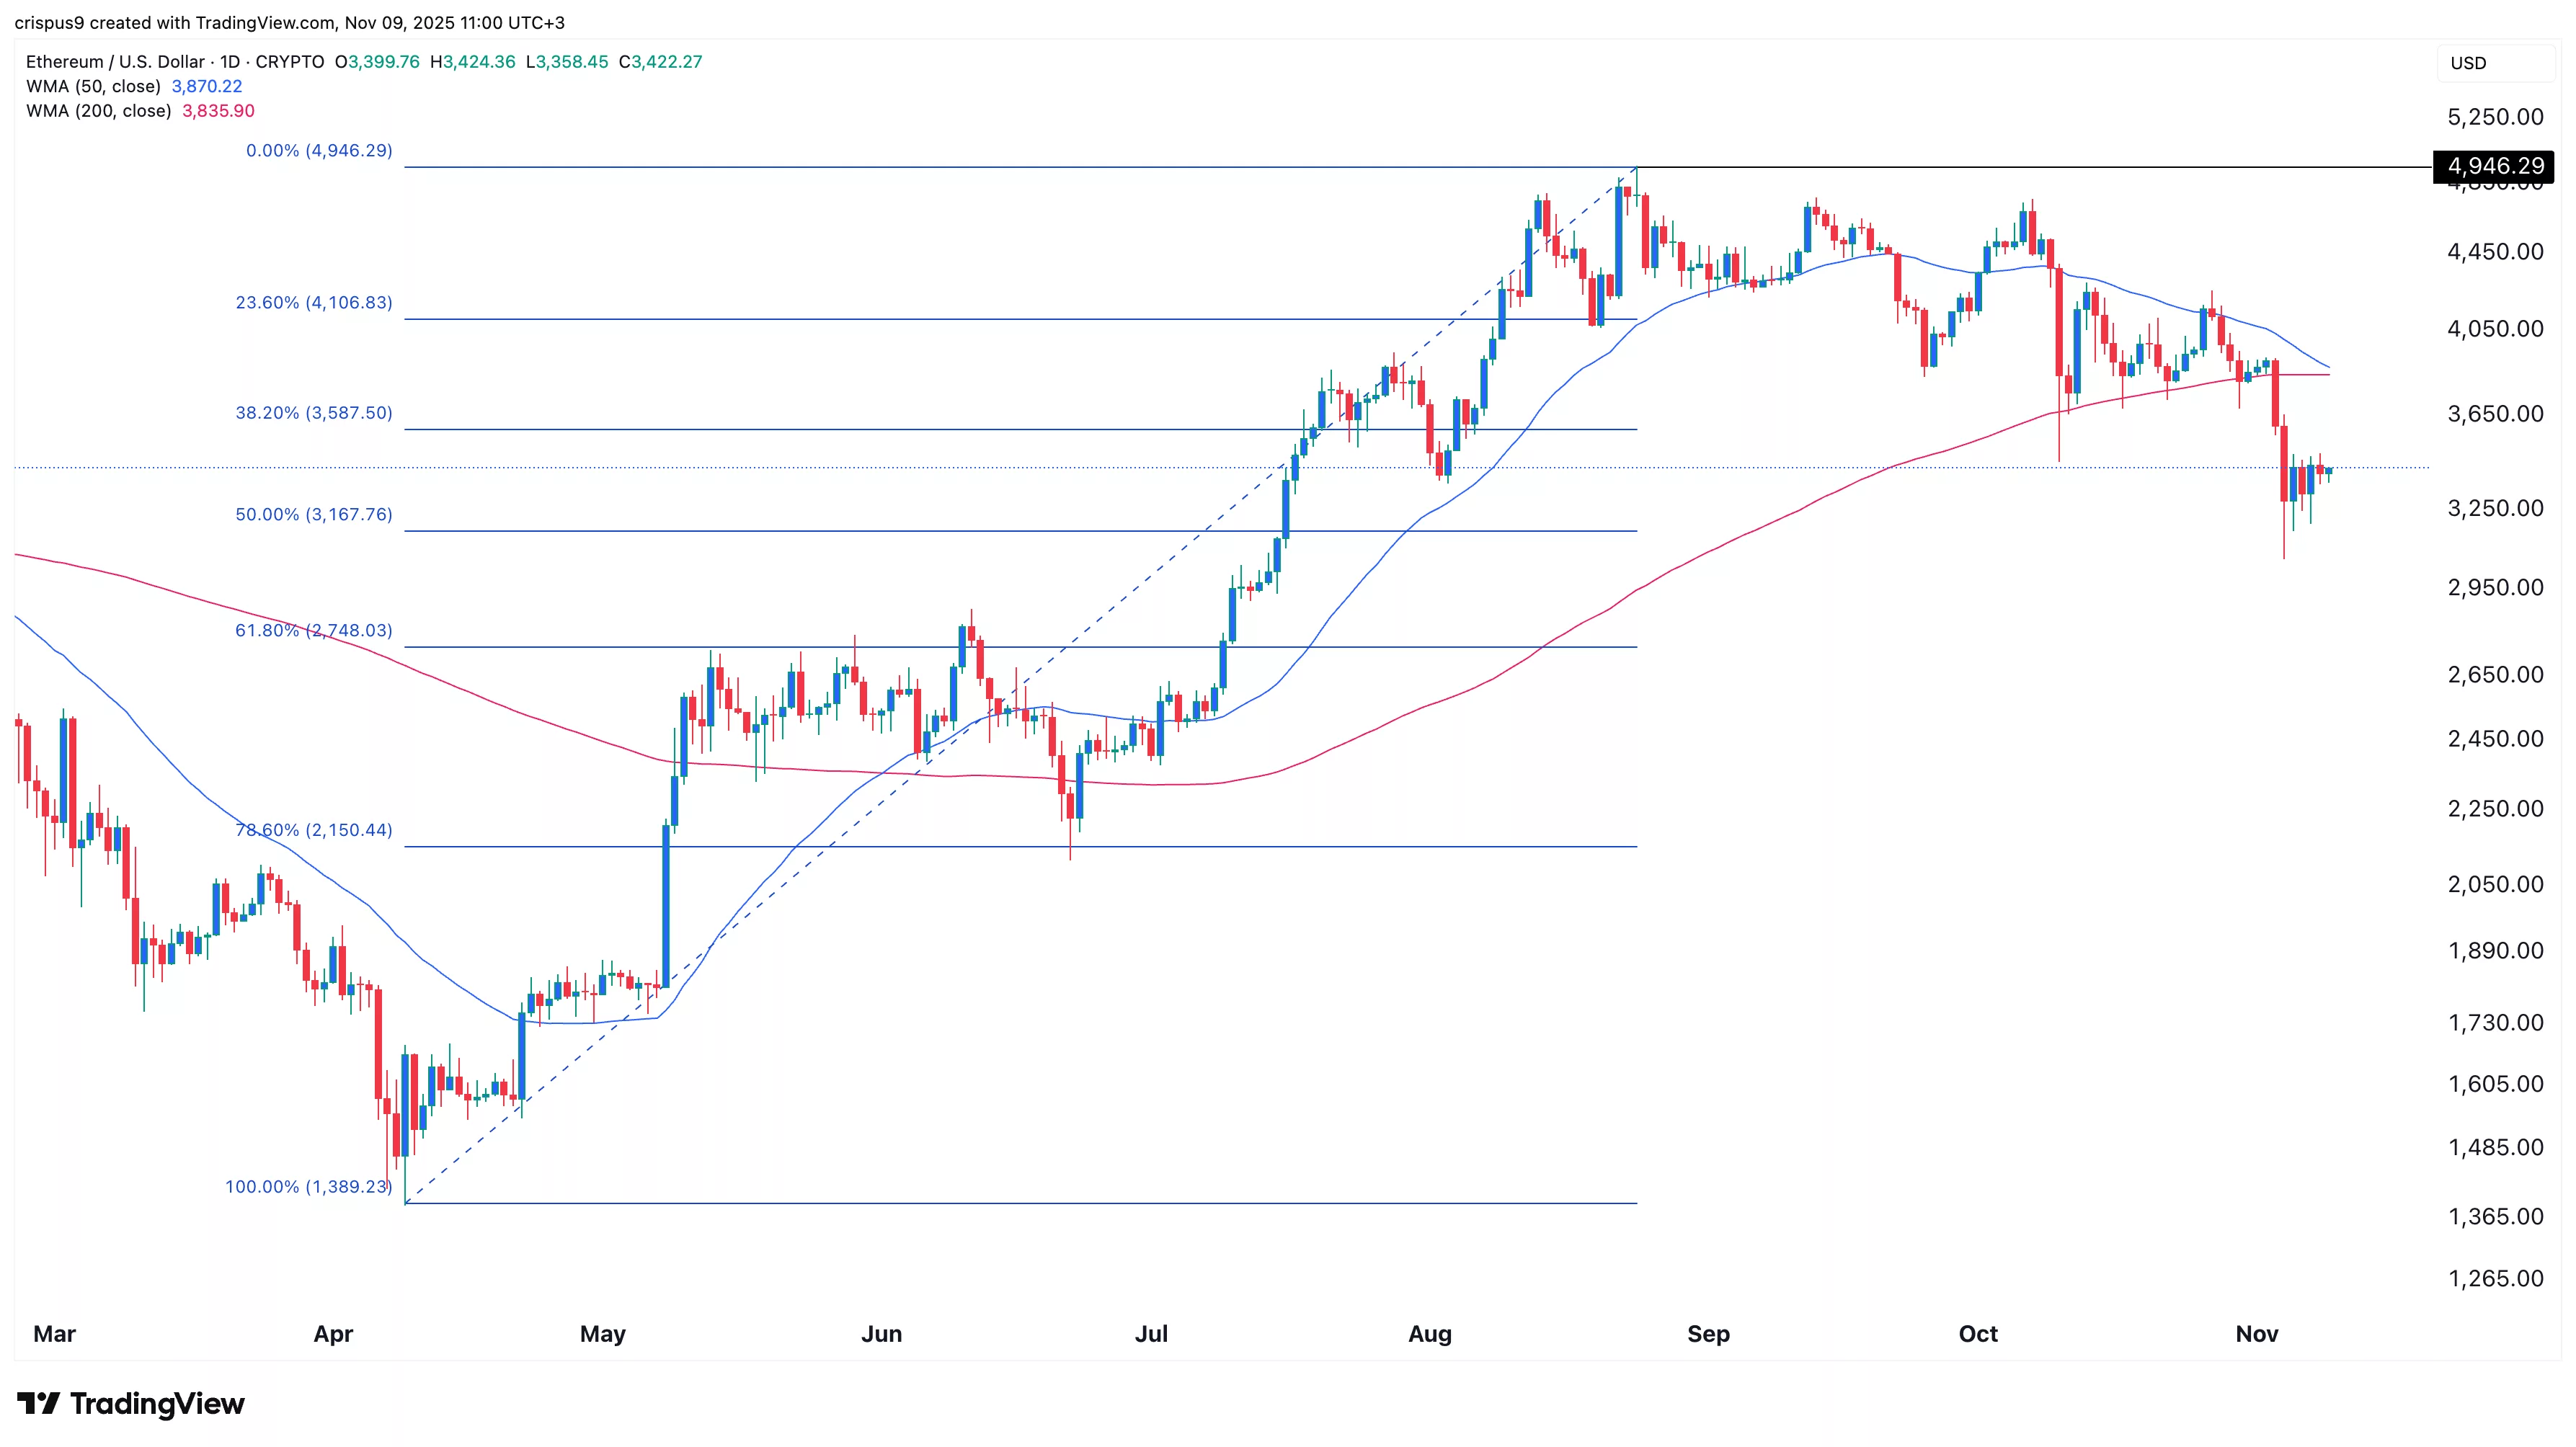
The recent ETH price crash may accelerate in the coming weeks. It is about to form a death cross pattern as the spread between the 50-day and 200-day Weighted Moving Average has plunged.
The coin is also in the process of forming a bearish pennant pattern, which is characterized by a vertical line and a symmetrical triangle. It also dropped below the 38.2% Fibonacci Retracement level.
Therefore, the coin will likely have a strong bearish breakout, potentially to the 50% retracement point at $3,100 followed by the psychological point at $3,000.
Disclosure: This article does not represent investment advice. The content and materials featured on this page are for educational purposes only.
Crypto Treasuries Chase A New Kind Of Capital
There is a peculiar irony at the heart of the crypto treasury movement. Companies that staked their futures on digital a... Read more
What Strategy's Bitcoin Sale Really Tells Us
There is a moment in every bull run when the narrative starts to fray. Not with a crash, not with a scandal, but with so... Read more
The Clock Is Ticking On UK Stablecoins
The world is not waiting for Britain to make up its mind. While the United States and the European Union have spent the ... Read more
From Cypherpunk To Citadel
How Crypto Moved from the Wild West to the Mainstream Financial SystemA long-form analysis of Bitcoin's journey from fri... Read more
Tether Plots Global Expansion
Stablecoin leader seeks to transform itself from crypto plumbing provider into a broad “freedom tech” conglomerateTe... Read more
World Liberty Seeks Federal Trust Charter
World Liberty Financial, the crypto venture backed by the Trump family, has applied for a US national bank trust charter... Read more