
Pi Network Price Remains Calm: Will It Rebound Or Crash?

Pi Network price has gone horizontal in the past four weeks as demand has remained weak and supply has continued rising.
Summary
- Pi Network price is stuck in a narrow range this year.
- Demand for the token has waned, with the 24-hour volume falling to $7 million.
- The token has formed a rising wedge pattern, pointing to a bearish breakdown.
Pi Coin (PI) value has been stuck at $0.2050, a key level that coincides with the lowest point in November. It has dropped by over 90% from its highest point in 2025.
The ongoing weakness has coincided with low volume, with the 24-hour figure falling to $7 million. Its volume was much lower, considering that the entire crypto market had a $60 billion volume in the same period. It is also a tiny amount for a cryptocurrency with a market capitalization of over $1.7 billion m
At the same time, the coin’s supply has continued rising because of its daily token unlocks. It is unlocking over 100 million tokens this month and 1.2 billion in the next 12 months.
More data shows that the number of whales in the network has dropped to 20 from 23 earlier this year. A Pi Network whale is defined as a user who holds tokens worth over $10 million. The biggest whale, however, has continued to accumulate the token and now holds over 393 million tokens worth over $80 million.
Pi Network price has also wavered as the news drought continues. The team has not made any significant market-moving announcement this year. The only news came out on January 10 when they launched a new developer library that enables Pi payments to be integrated into Pi apps easily.
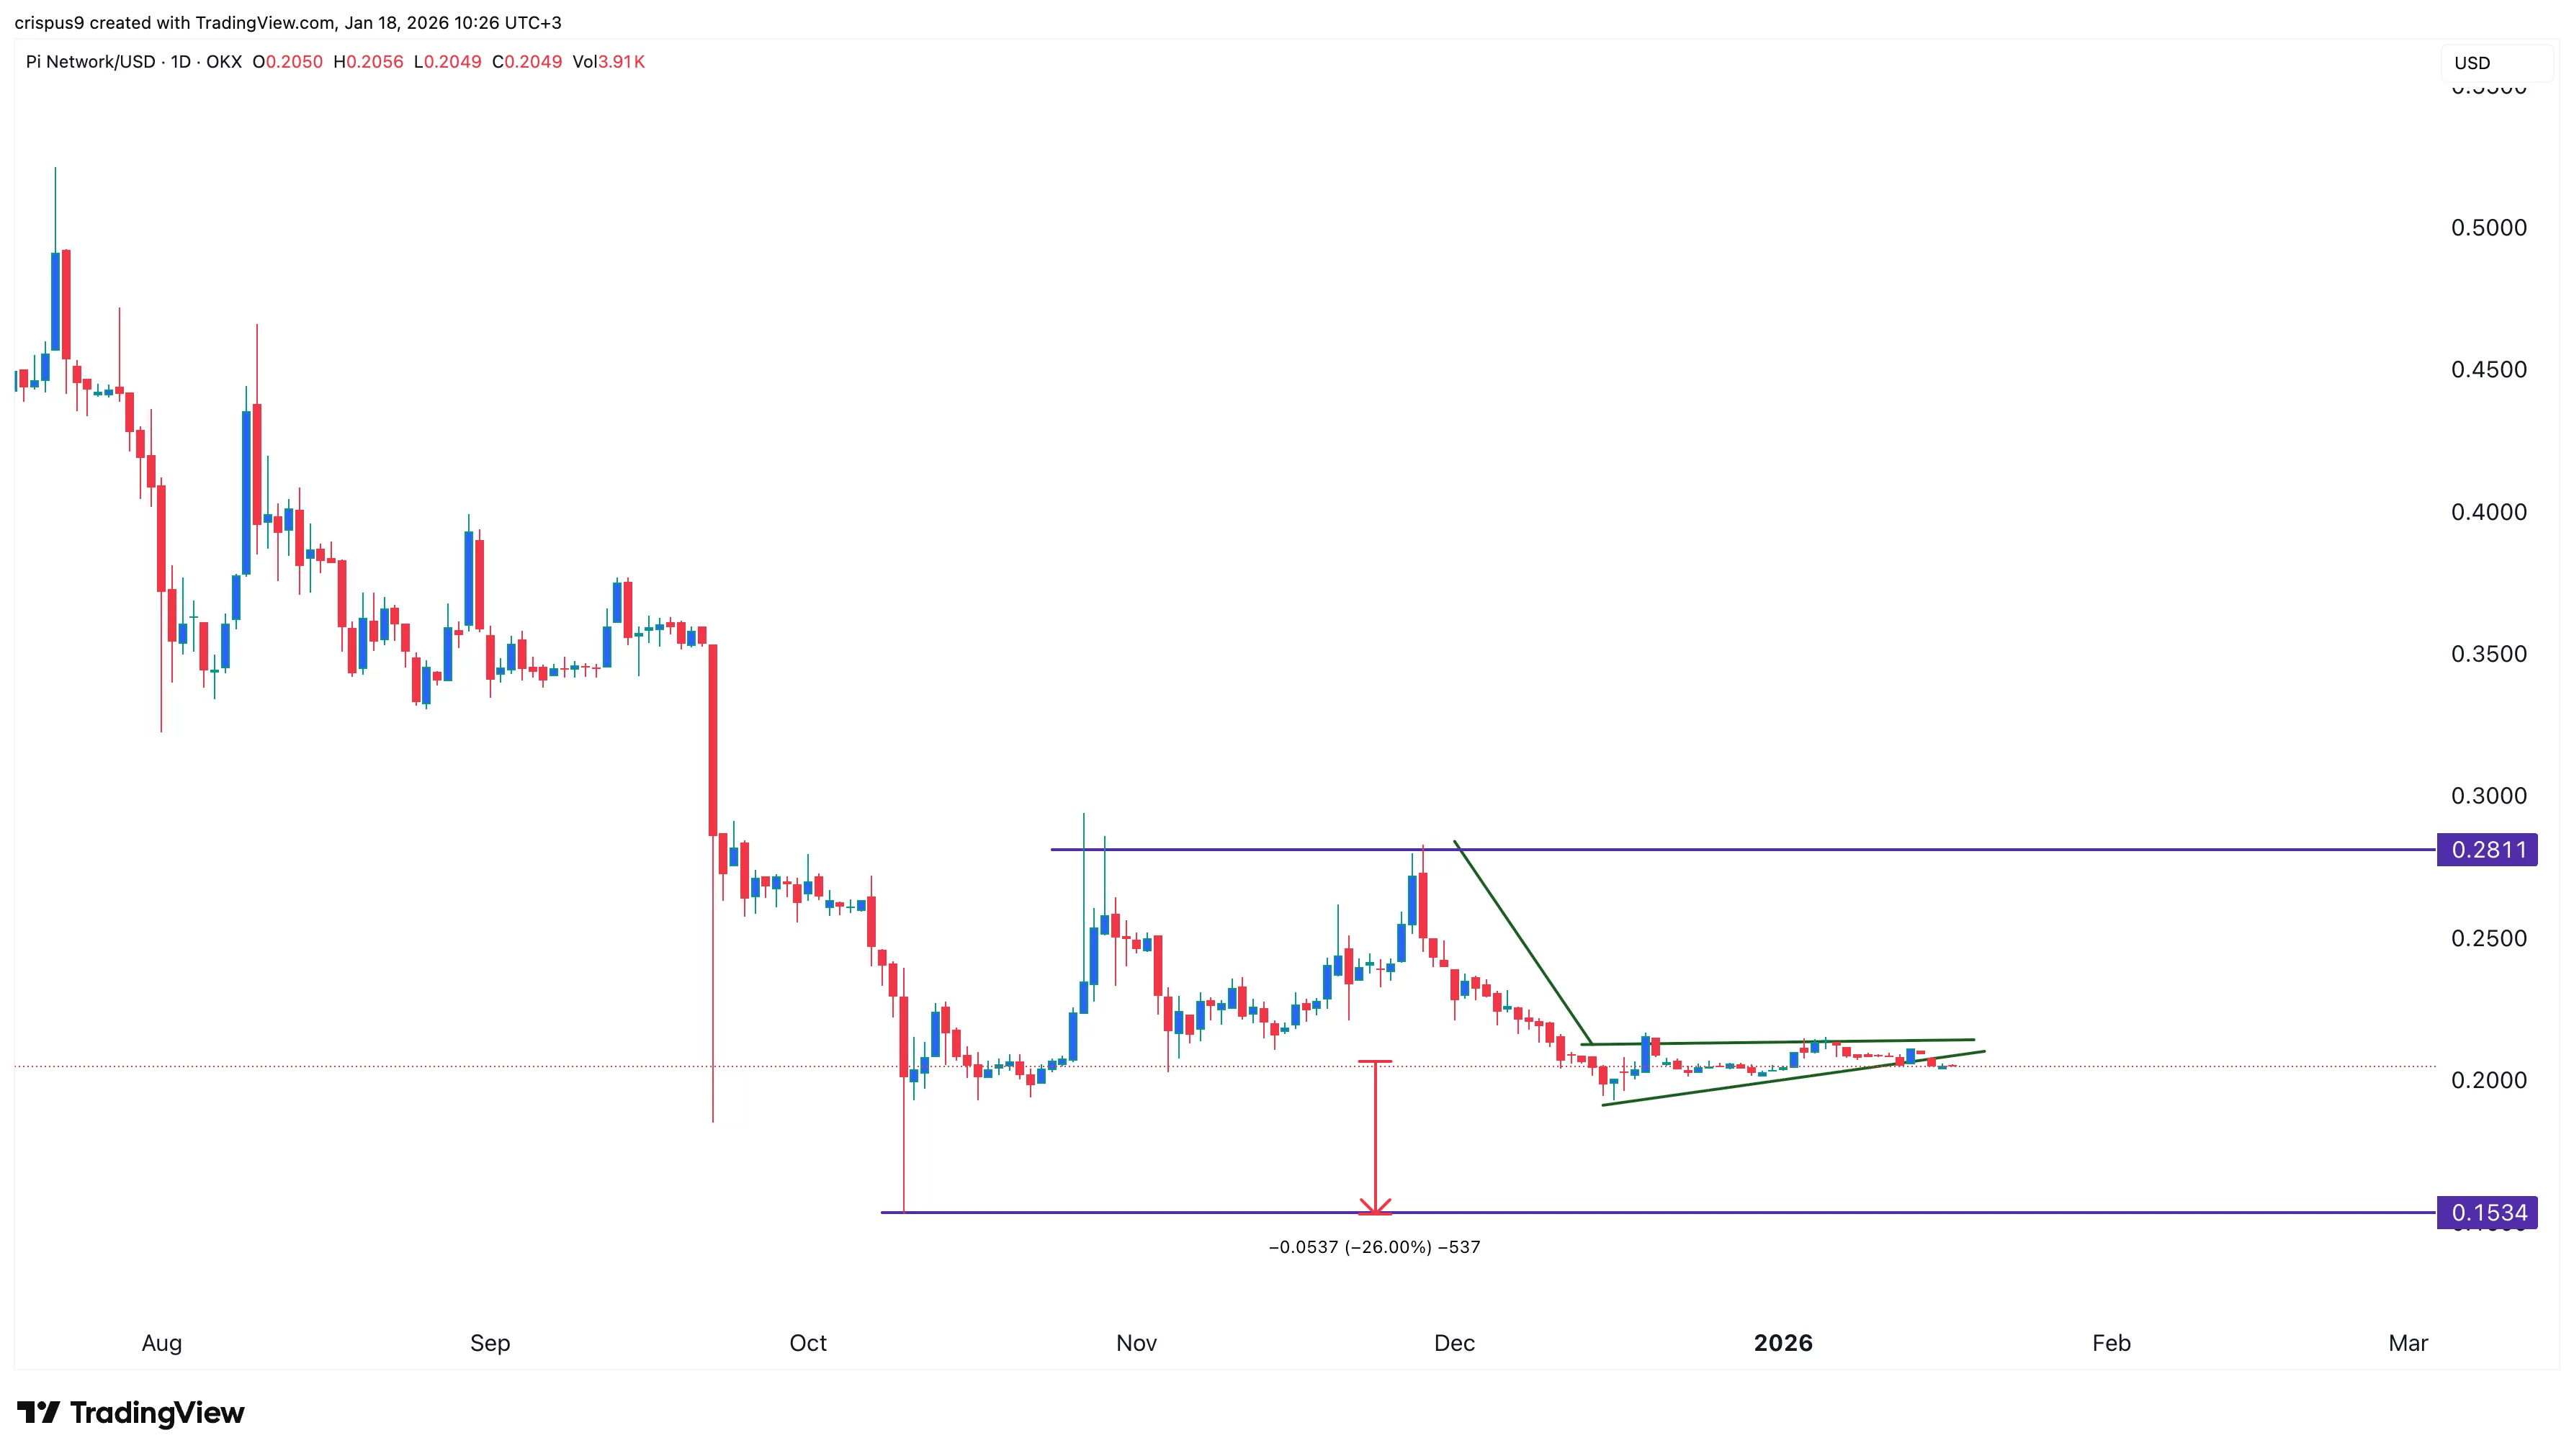
The daily timeframe chart shows that the Pi Coin price has moved sideways in the past few weeks. As a result, the Average True Range indicator has dropped, a sign that it has low volatility
The token has remained below the 50-day Exponential Moving Average and the Supertrend indicator. Most importantly, it has formed a rising wedge pattern, which is made up of two ascending and converging trendlines.
The token has also formed a bearish pennant pattern. Therefore, the most likely scenario is where it suffers a big bearish breakdown in the next few days as sellers target the all-time low of $0.1534, which it fell to in October last year.
On the other hand, a move above the resistance level at $0.2250 will invalidate the bearish outlook.
Crypto Treasuries Chase A New Kind Of Capital
There is a peculiar irony at the heart of the crypto treasury movement. Companies that staked their futures on digital a... Read more
What Strategy's Bitcoin Sale Really Tells Us
There is a moment in every bull run when the narrative starts to fray. Not with a crash, not with a scandal, but with so... Read more
The Clock Is Ticking On UK Stablecoins
The world is not waiting for Britain to make up its mind. While the United States and the European Union have spent the ... Read more
From Cypherpunk To Citadel
How Crypto Moved from the Wild West to the Mainstream Financial SystemA long-form analysis of Bitcoin's journey from fri... Read more
Tether Plots Global Expansion
Stablecoin leader seeks to transform itself from crypto plumbing provider into a broad “freedom tech” conglomerateTe... Read more
World Liberty Seeks Federal Trust Charter
World Liberty Financial, the crypto venture backed by the Trump family, has applied for a US national bank trust charter... Read more