
Heres Why Solana Price Plummeted As SOL ETFs Crossed $500m Milestone

Solana price is languishing at a technical bear market after plunging by over 27% from its highest level in August this year.
Summary
- Solana price has plunged into a bear market after falling by 27% from the year-to-date high.
- Spot SOL ETFs crossed the important $500 million milestone on Friday.
- They have had cumulative inflows of almost $200 million.
Solana price drops despite ETF launches
Solana (SOL) token was trading at $185 today, Nov. 1, much lower than the year-to-date high of nearly $300.
SOL token remains in a bear market, even after the Securities and Exchange Commission gave its go-ahead for the spot Solana ETFs this week.
These funds have received a warm welcome from American investors who see cryptocurrencies as viable alternative assets. Data compiled by SoSoValue shows that these funds have had inflows worth about $200 million.
Their total assets have also crossed the $500 million milestone, which is equivalent to 0.50% of the token’s market capitalization.
Bitwise’s BSOL ETF is leading the way with $400 million in total assets because of its first-mover advantage and its lower fees. It has an expense ratio of 0.20%, lower than Grayscale’s 0.35%. Grayscale offsets this fee by offering staking solutions, allowing investors to earn up to a 7.5% yield.
There are two possible reasons why the Solana price has dropped after the ETF launches. First, the launches happened in a difficult week for the market when most tokens plunged.
Bitcoin (BTC) dropped to $108,000 while the market cap of all tokens fell to $3.7 trillion. It is common for even the strongest tokens to plunge when there is a broader sell-off.
The other possible reason is that traders are selling the news. This is a situation where crypto assets plunge ahead of a major event and then drop when it happens.
Looking ahead, the possible catalysts for Solana will be the upcoming approval of more ETFs and the Alpenglow upgrade that will boost its performance.
SOL price technical analysis
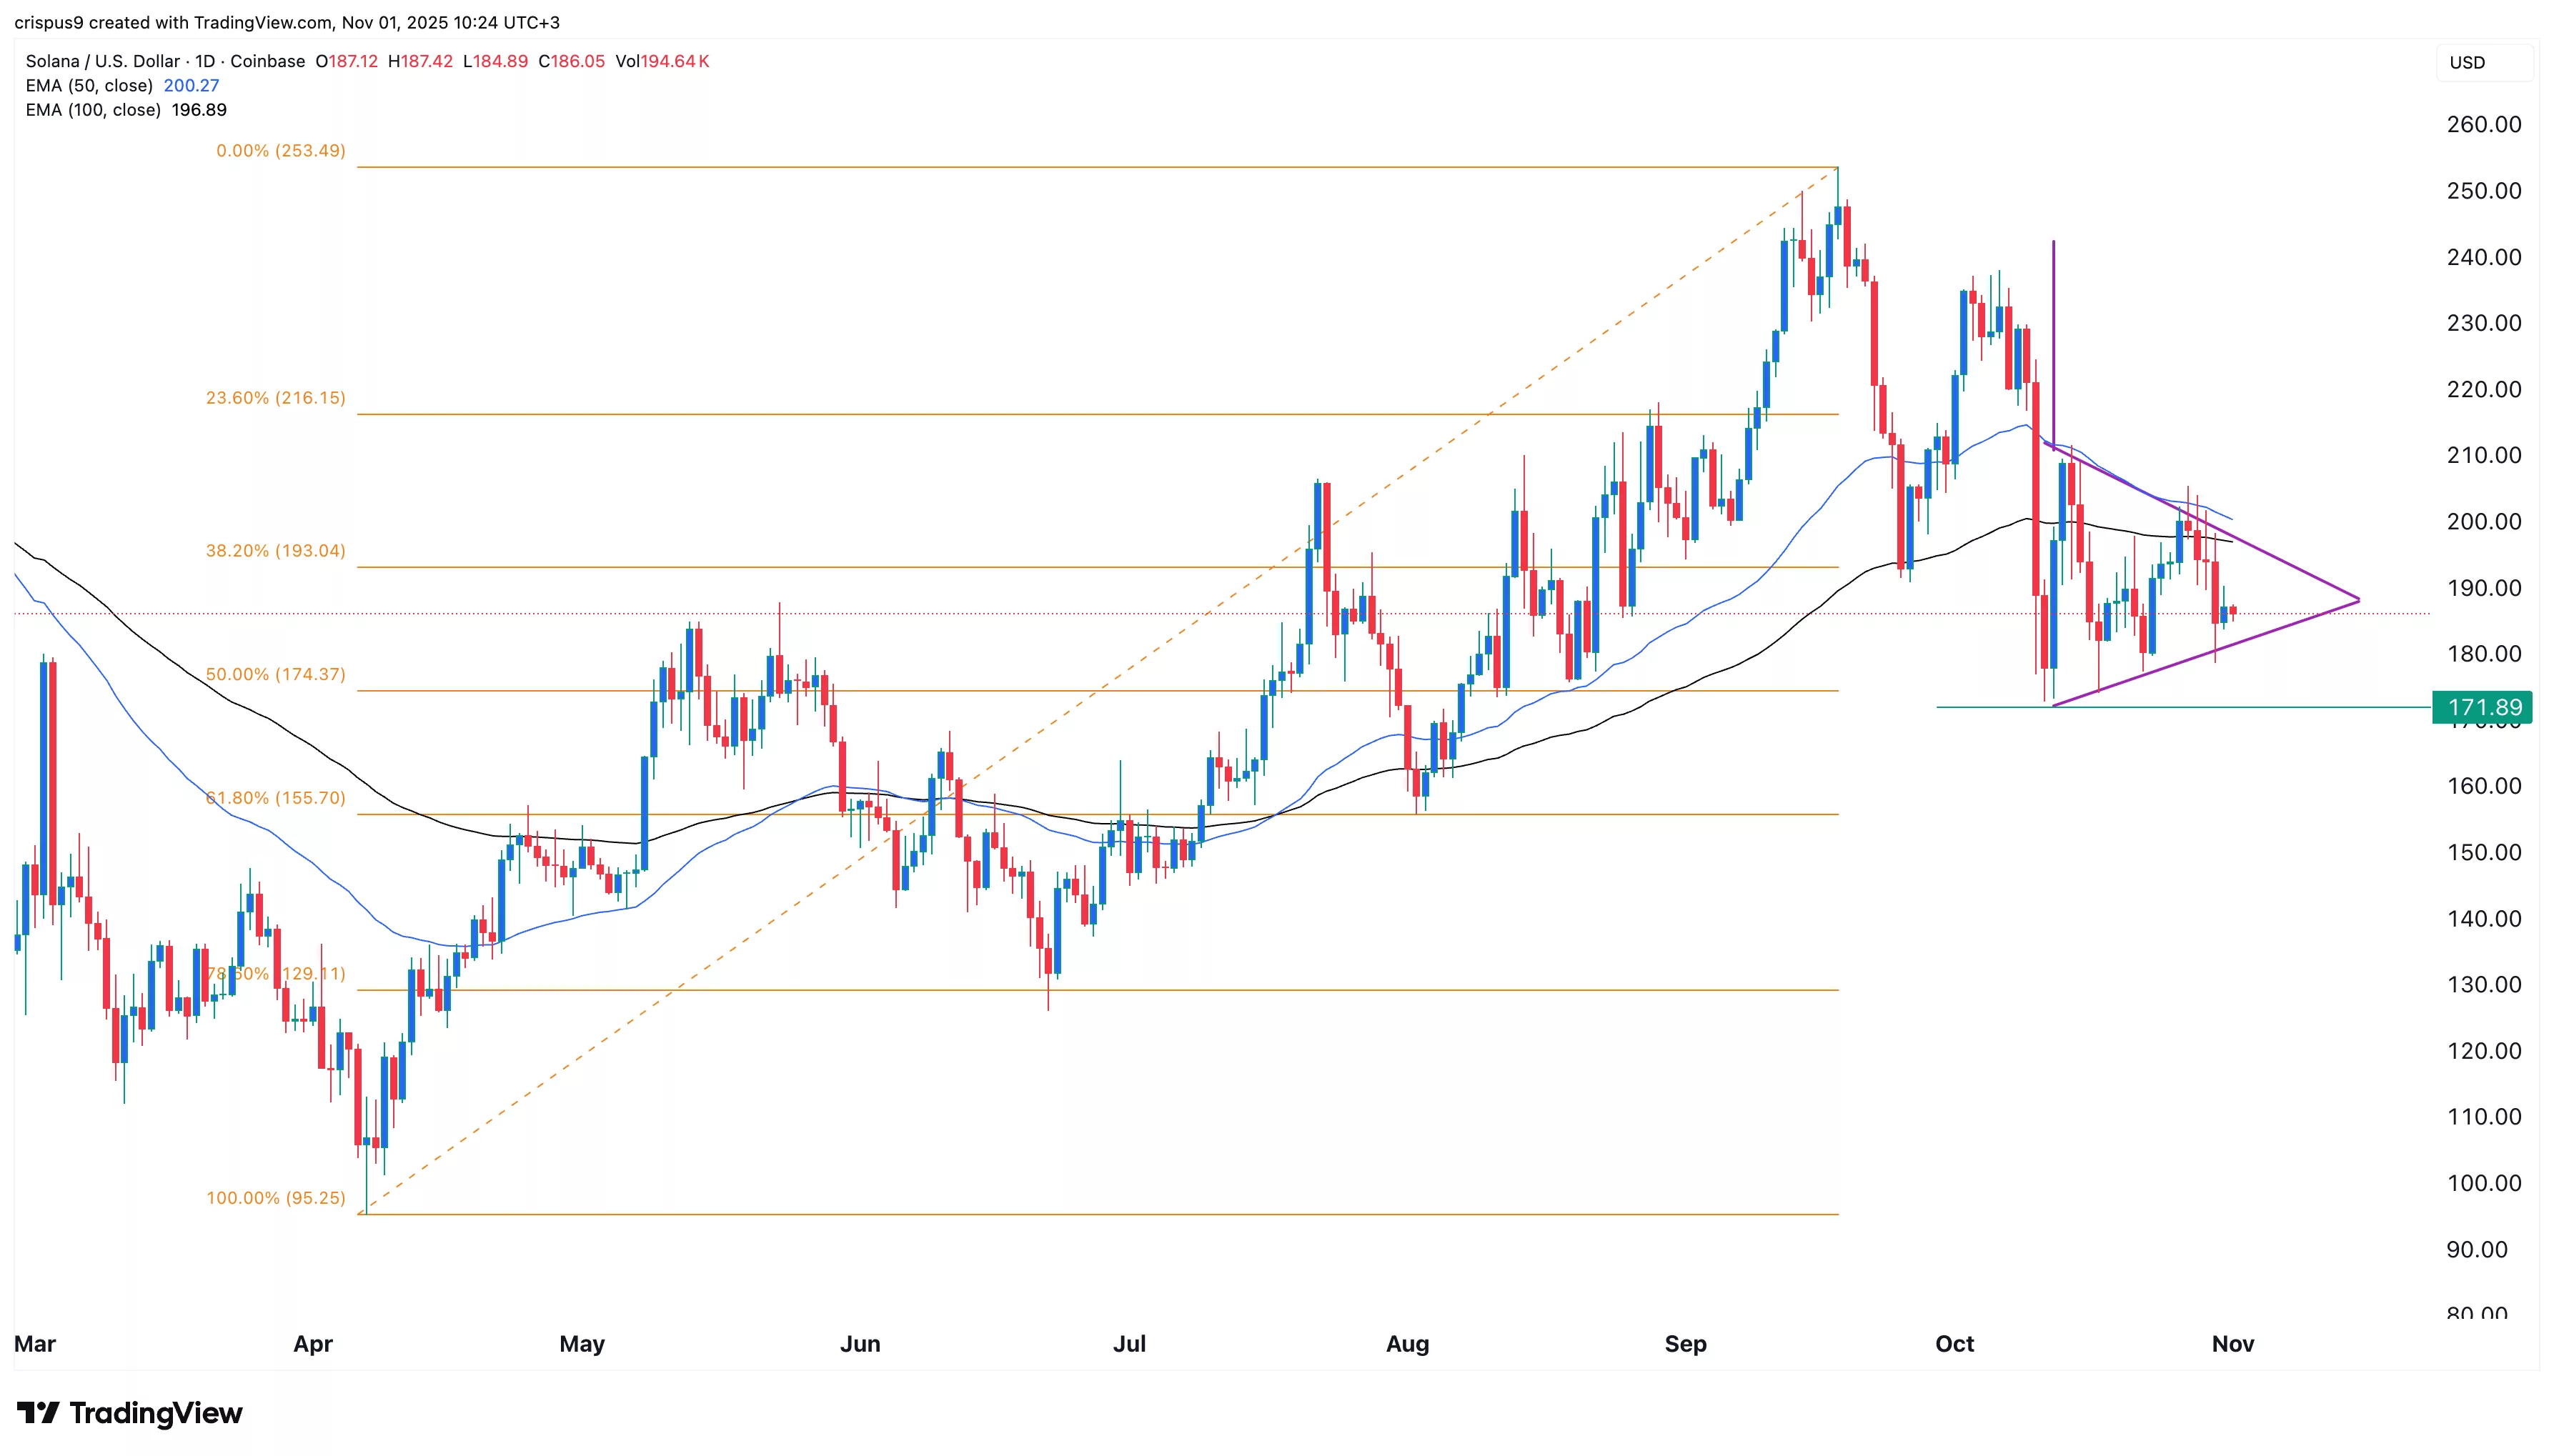
The daily chart shows that the Solana price has dropped in the past few months. It has now moved below the 38.2% Fibonacci Retracement level.
SOL price also moved below the 50-day and 100-day Exponential Moving Averages. Most notably, it is in the process of completing the formation of the bearish pennant pattern. It is also lower than the Supertrend indicator.
Therefore, the token will likely continue falling as sellers target the next key support level at $171, the lowest level on Oct. 11, and the 50% retracement level. A drop below that level will point to more downside, potentially to $150.
Crypto Treasuries Chase A New Kind Of Capital
There is a peculiar irony at the heart of the crypto treasury movement. Companies that staked their futures on digital a... Read more
What Strategy's Bitcoin Sale Really Tells Us
There is a moment in every bull run when the narrative starts to fray. Not with a crash, not with a scandal, but with so... Read more
The Clock Is Ticking On UK Stablecoins
The world is not waiting for Britain to make up its mind. While the United States and the European Union have spent the ... Read more
From Cypherpunk To Citadel
How Crypto Moved from the Wild West to the Mainstream Financial SystemA long-form analysis of Bitcoin's journey from fri... Read more
Tether Plots Global Expansion
Stablecoin leader seeks to transform itself from crypto plumbing provider into a broad “freedom tech” conglomerateTe... Read more
World Liberty Seeks Federal Trust Charter
World Liberty Financial, the crypto venture backed by the Trump family, has applied for a US national bank trust charter... Read more