
Heres Why Pi Network Price Crashed To A Record Low

Pi Network price crashed to a record low of $0.1450, January 31, as the crypto market dived and as demand waned.
Summary
- Pi Network price crashed to a record low on Monday.
- The drop happened as Bitcoin and other altcoins dropped.
- Technical analysis suggests that the coin has more downside.
Pi Coin (PI) token plunged to a low of $0.140, a few points below its previous all-time low of $0.1545. It has now plunged by over 93% from its record high of $2.98, which it reached in February last year shortly after its mainnet launch.
The main reason why Pi Coin price plunged is that sentiment in the crypto market waned. Bitcoin (BTC) and other altcoins were all in the red, with the market capitalization of all tokens falling by over 6% in the last 24 hours.
The decline happened amid rising geopolitical fears because of Donald Trump’s warning on Iran’s officials to agree to talks or risk an attack. Odds of an attack have continued rising on Polymarket and other prediction marketplaces. Such an attack would lead to higher volatility, crude oil prices, and inflation.
Pi Network price also crashed as the selling pressure continued. Data compiled by CoinMarketCap shows that the coin’s volume rose to $28 million on Monday, up from $7 million a day earlier. This surge in volume is a sign that many holders have started to capitulate and dump the token.
The rising selling has coincided with the ongoing token unlocks. Data shows that Pi will unlock over 133 million tokens f in February and 1.3 billion in the next 12 months. Token unlocks lead to higher supply over time.
Meanwhile, investors have reacted mildly to the latest news, including the new approach to KYC verification that will make it possible for most pioneers to migrate to the mainnet.
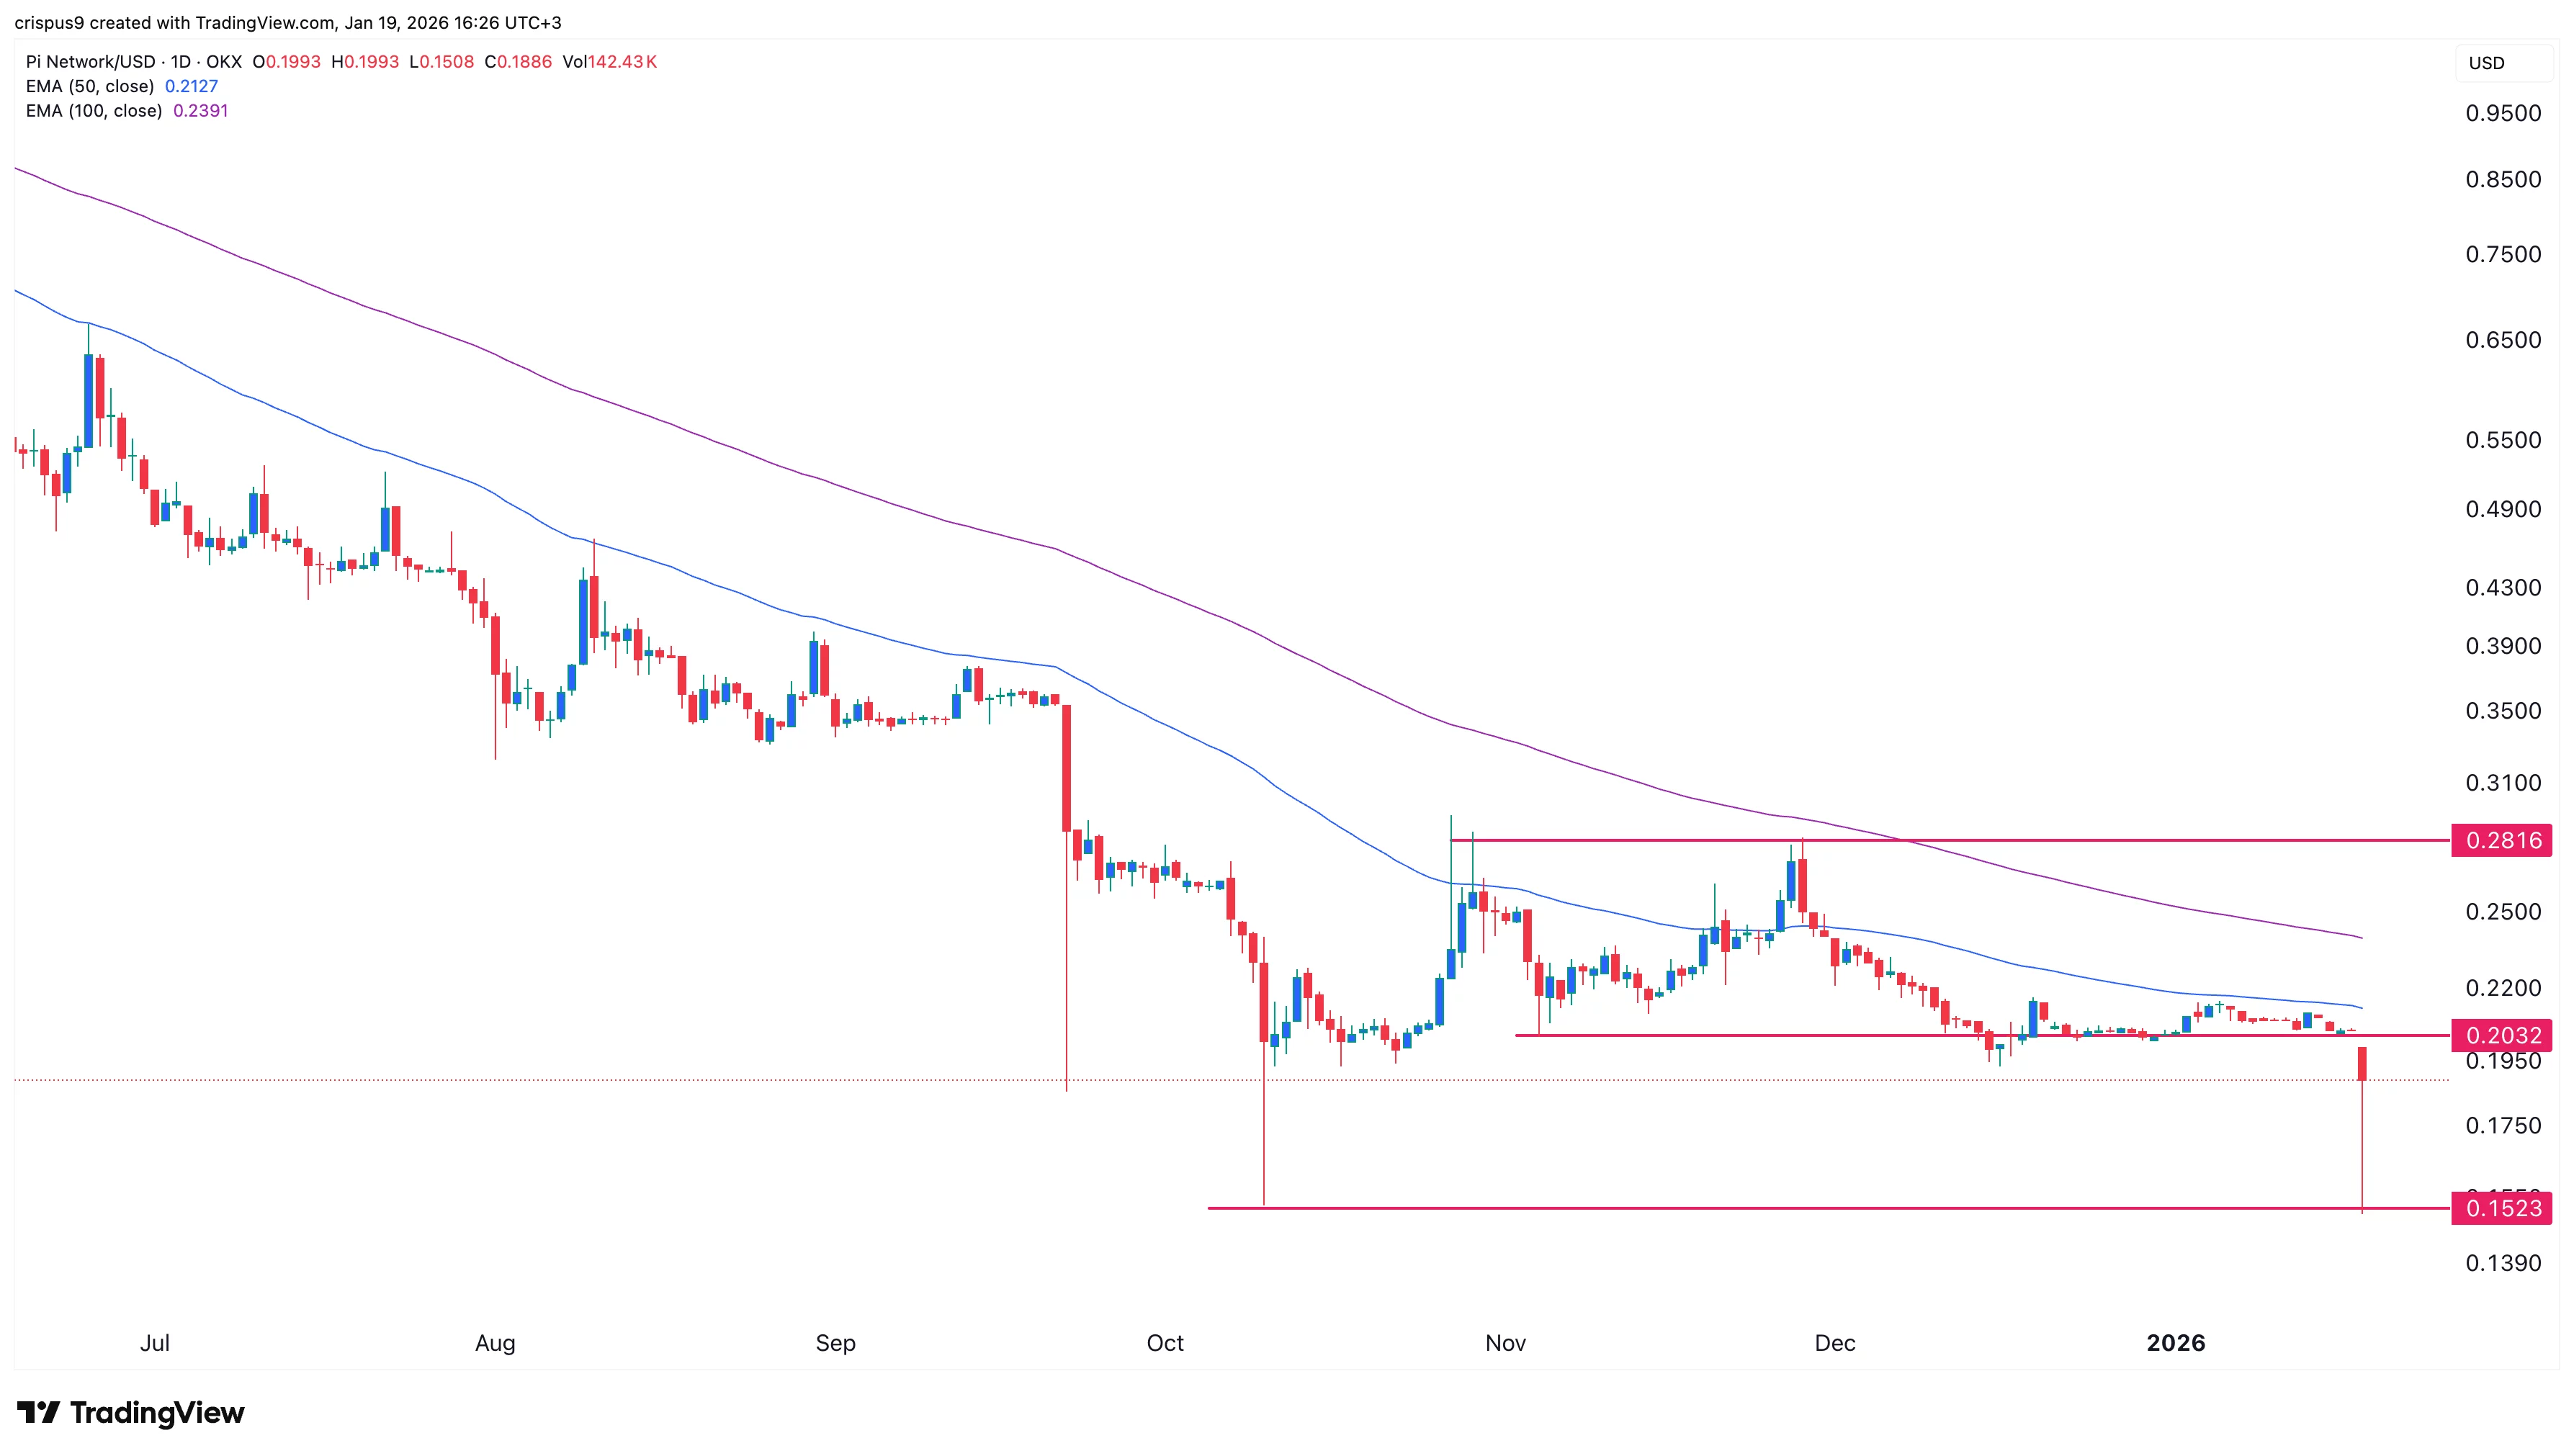
The daily timeframe chart shows that the value of Pi plunged to a record low on Monday. This retreat happened after it formed a rising wedge, which is made up of two ascending and converging trendlines. A rising wedge is one of the most common bearish reversal signs.
The token also formed a double-top pattern at $0.2816, its highest point in October and November last year. It was also much lower than the 50-day and 100-day Exponential Moving Averages.
Therefore, the coin will likely continue falling as it lacks a clear bullish catalyst. A move below the all-time low of $0.1523 will point to more downside, potentially to $0.10.
Crypto Treasuries Chase A New Kind Of Capital
There is a peculiar irony at the heart of the crypto treasury movement. Companies that staked their futures on digital a... Read more
What Strategy's Bitcoin Sale Really Tells Us
There is a moment in every bull run when the narrative starts to fray. Not with a crash, not with a scandal, but with so... Read more
The Clock Is Ticking On UK Stablecoins
The world is not waiting for Britain to make up its mind. While the United States and the European Union have spent the ... Read more
From Cypherpunk To Citadel
How Crypto Moved from the Wild West to the Mainstream Financial SystemA long-form analysis of Bitcoin's journey from fri... Read more
Tether Plots Global Expansion
Stablecoin leader seeks to transform itself from crypto plumbing provider into a broad “freedom tech” conglomerateTe... Read more
World Liberty Seeks Federal Trust Charter
World Liberty Financial, the crypto venture backed by the Trump family, has applied for a US national bank trust charter... Read more