
Hedera Price Supertrend Points To A Dive Despite The Ongoing HBAR ETF Inflows

Hedera price pulled back after hitting an important resistance as the exchange-traded fund approval hype faded.
Summary
- HBAR price has moved into a correction after falling by 11% from its highest point this week.
- The token is falling despite the ongoing HBAR ETF inflows.
- Technicals suggest that the Hedera price will continue falling.
Hedera (HBAR) token dropped to $0.1965, down by 12% from its highest point this week and 50% from the year-to-date high.
HBAR price has crashed because of the ongoing sell-off in the crypto market after the hawkish Federal Reserve interest rate decision on Wednesday.
The token also pulled back as investors sold the HBAR ETF approval news. This is a situation where investors buy an asset ahead of a major event and then sell it once the news event happens.
It happens as the hype surrounding the event fades and as investors start focusing on the next big thing or news event.
Data compiled by SoSoValue shows that the recently-launched HBAR ETF continues to gain mild interest from American investors. It had net inflows of $2.2 million on Wednesday when it was launched, a figure that jumped to $29 million on Thursday.
The cumulative ETF inflows have jumped to $32 million. While this figure is higher than Litecoin’s $485,000, it is much lower than Solana (SOL), whose ETFs crossed the $154 million inflows milestone.
The divergence between the spot Hedera and Solana ETF inflows is understandable because the former is a bigger and more popular player in the crypto industry. Hedera has a market capitalization of over $8 billion while Solana is valued at over $102 billion.
Solana is also more popular among users and developers. It has 387 DeFi dApps with a total value locked of $12.3 billion, much higher than Hedera’s 23 dApps and $194 million in TVL.
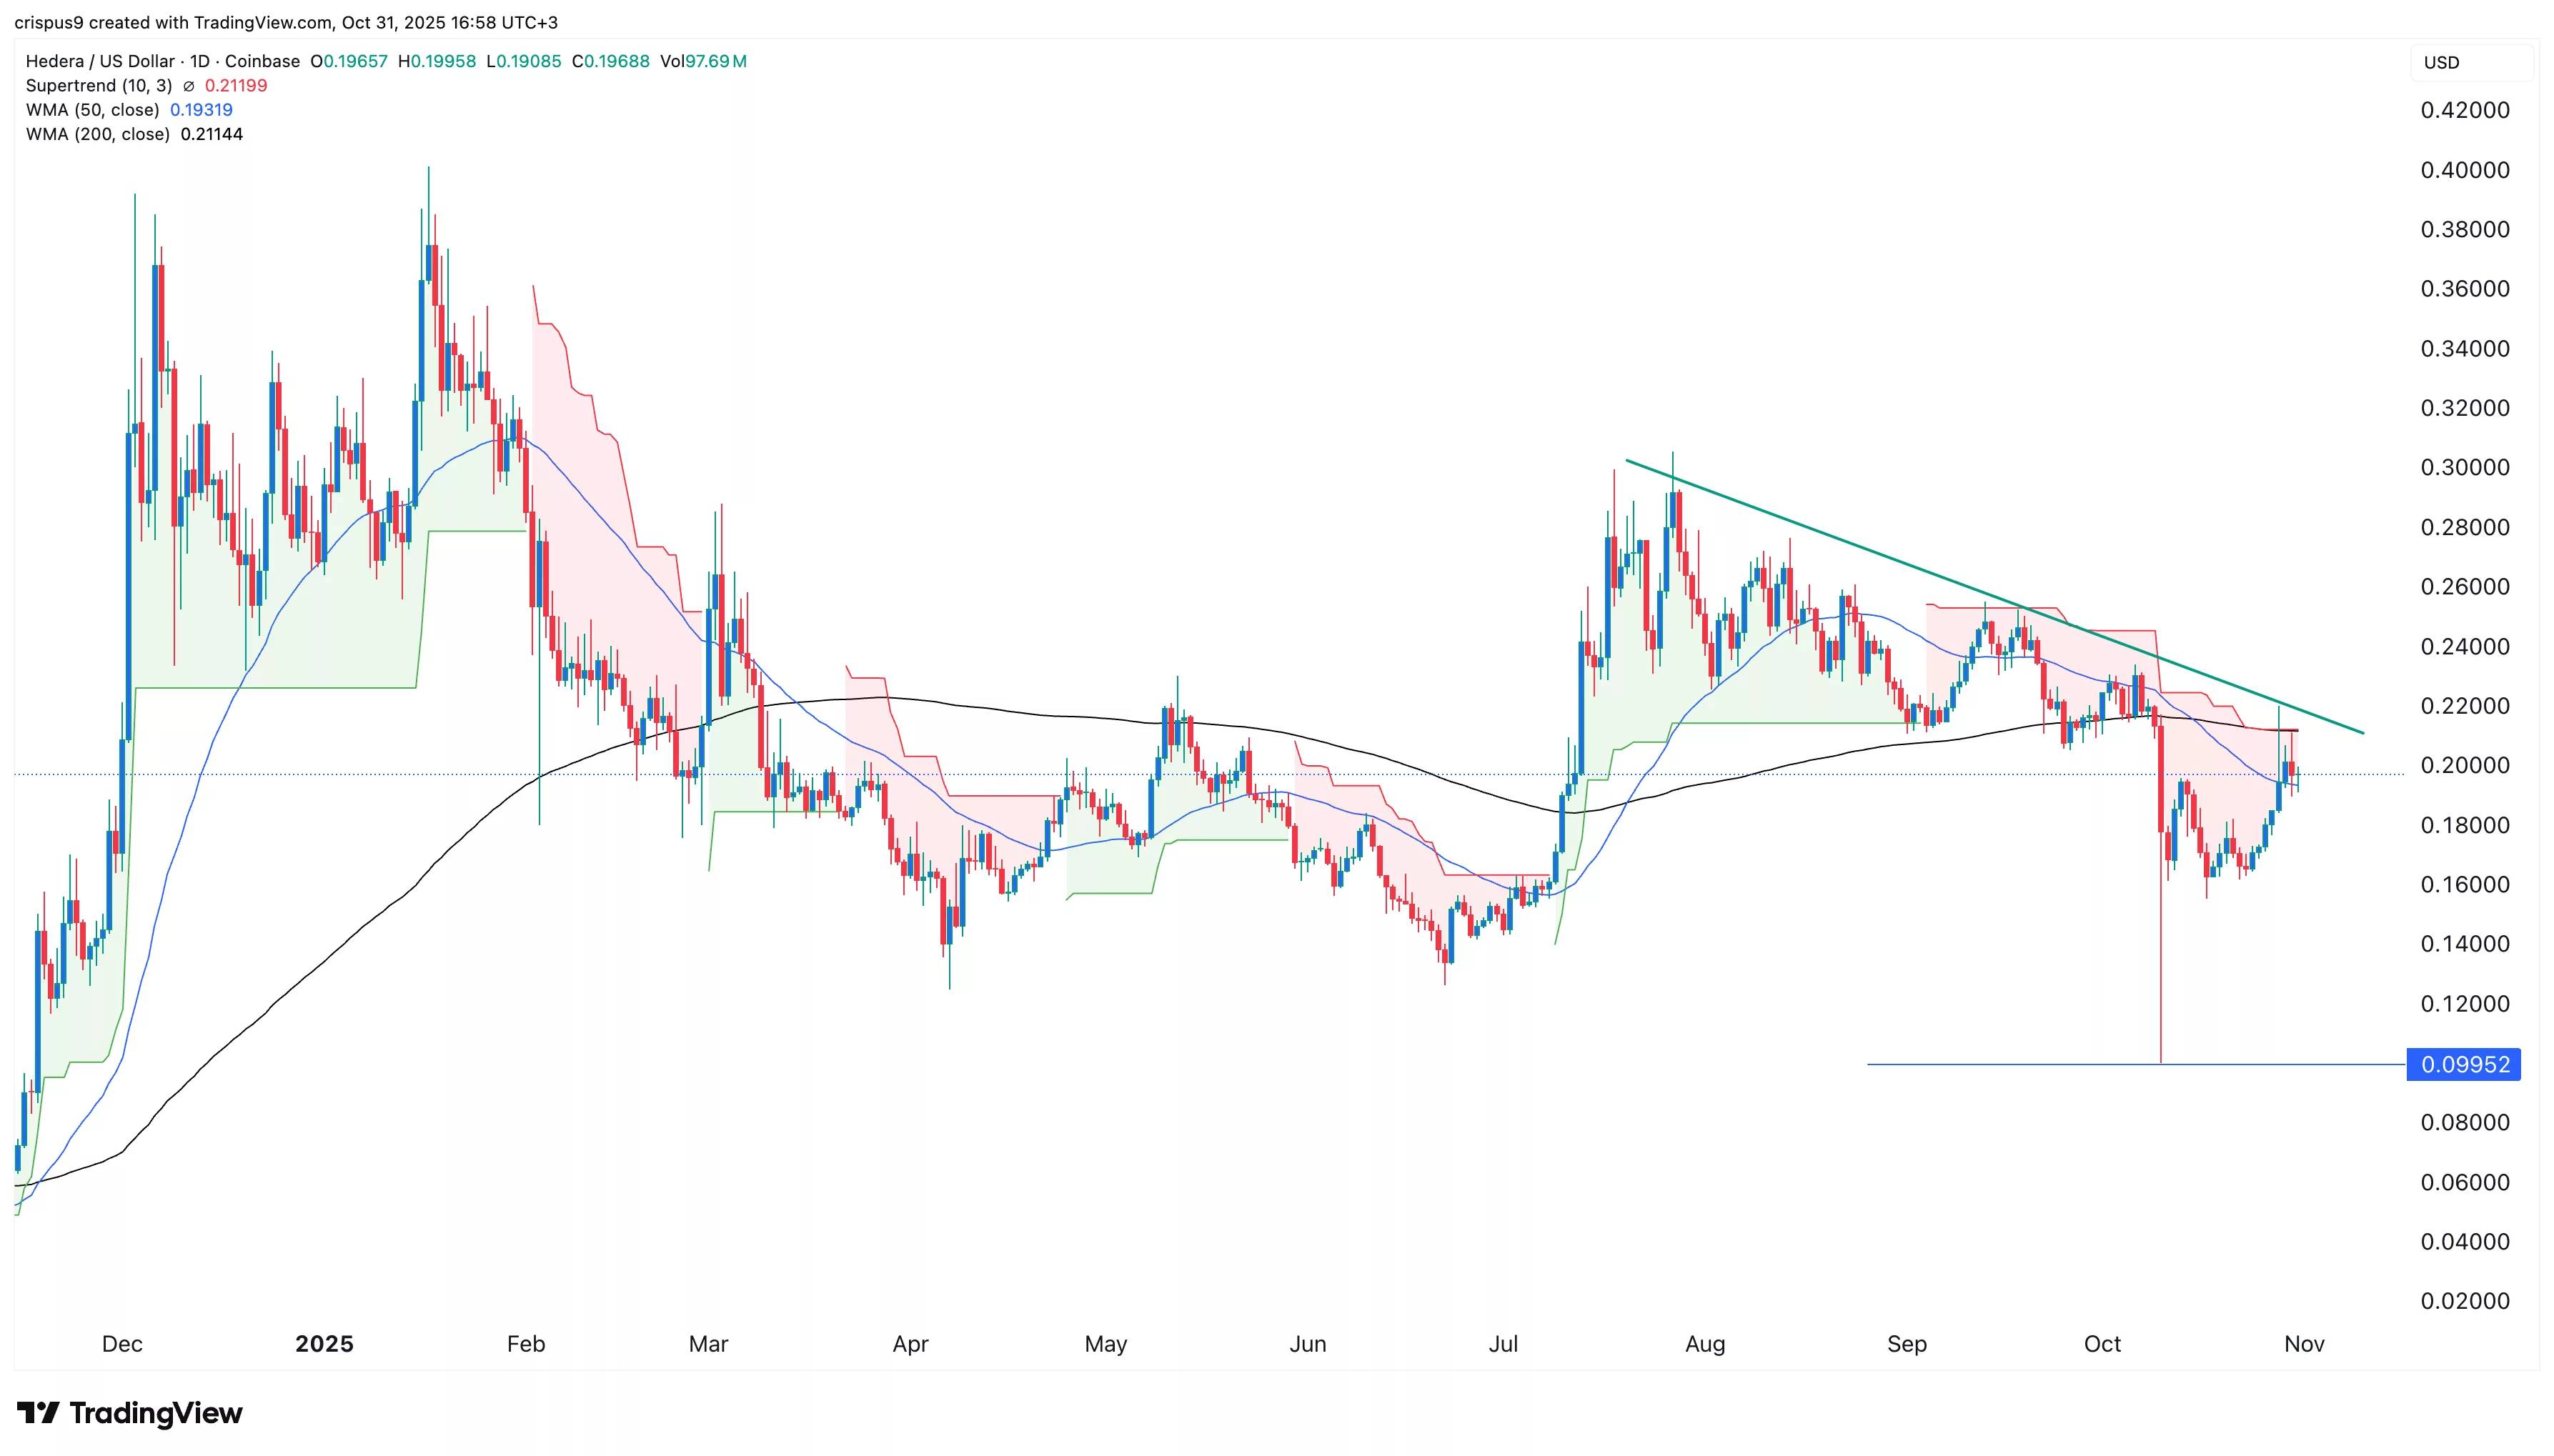
The daily timeframe chart shows that the HBAR price jumped to a high of $0.2196 on October 28 and then pulled back to the current $0.1950. Its highest level was notable as it coincided with the descending trendline that connects the highest swings since July 27.
The token has moved below the Supetrend indicator, a sign that bears are in control. It remains below the Ichimoku cloud indicator, while the 50-day and 200-day Exponential Moving Averages have formed a death cross pattern.
Therefore, the most likely HBAR price forecast is where it continues its downtrend, and possibly hits the psychological level at $0.1500. On the other hand, a move above that descending trendline will point to more upside.
Crypto Treasuries Chase A New Kind Of Capital
There is a peculiar irony at the heart of the crypto treasury movement. Companies that staked their futures on digital a... Read more
What Strategy's Bitcoin Sale Really Tells Us
There is a moment in every bull run when the narrative starts to fray. Not with a crash, not with a scandal, but with so... Read more
The Clock Is Ticking On UK Stablecoins
The world is not waiting for Britain to make up its mind. While the United States and the European Union have spent the ... Read more
From Cypherpunk To Citadel
How Crypto Moved from the Wild West to the Mainstream Financial SystemA long-form analysis of Bitcoin's journey from fri... Read more
Tether Plots Global Expansion
Stablecoin leader seeks to transform itself from crypto plumbing provider into a broad “freedom tech” conglomerateTe... Read more
World Liberty Seeks Federal Trust Charter
World Liberty Financial, the crypto venture backed by the Trump family, has applied for a US national bank trust charter... Read more