
Ethereum Price Forms Bullish Flag As ETH ETF Inflows Rise

Ethereum price has plunged into a bear market after falling by over 20% from its highest point this year as cryptocurrencies retreated.
Summary
- Ethereum price has formed a bullish flag pattern on the weekly chart.
- Spot ETH ETF recorded over $114 million in inflows last week.
- Technical indicators suggest the coin will rebound in the near term.
Ethereum (ETH) token was trading at $3,895 on Nov. 2, up by 178% from its lowest level this year. It has formed a bullish flag pattern, pointing to more gains as exchange-traded funds inflows rise.
Data compiled by SoSoValue shows that spot Ethereum ETFs outperformed Bitcoin (BTC) last week. These funds added over $114 million in inflows after shedding over $243 million in the previous week. In contrast, Bitcoin ETFs shed over $607 million in assets.
Spot Ethereum ETFs have added over $14.3 billion in inflows since their inception in July last year. These gains were driven mainly by BlackRock’s ETHA, which now holds over $15.15 billion in assets. The other top Ethereum ETFs are by companies like Grayscale, Fidelity, and Bitwise.
Top companies have also continued to accumulate Ethereum in the past few months. CoinGecko data shows that companies like BitMine, SharpLink, Bit Digital, and ETHZilla hold Ethereum tokens worth over $18.5 billion.
Ethereum’s funding rate has remained above zero, a sign that investors are optimistic that its future price will be higher than where it is today.
Additionally, the futures open interest has remained stable at over $45 billion despite the ongoing retreat. Its shorts and longs liquidations have retreated in the past few weeks.
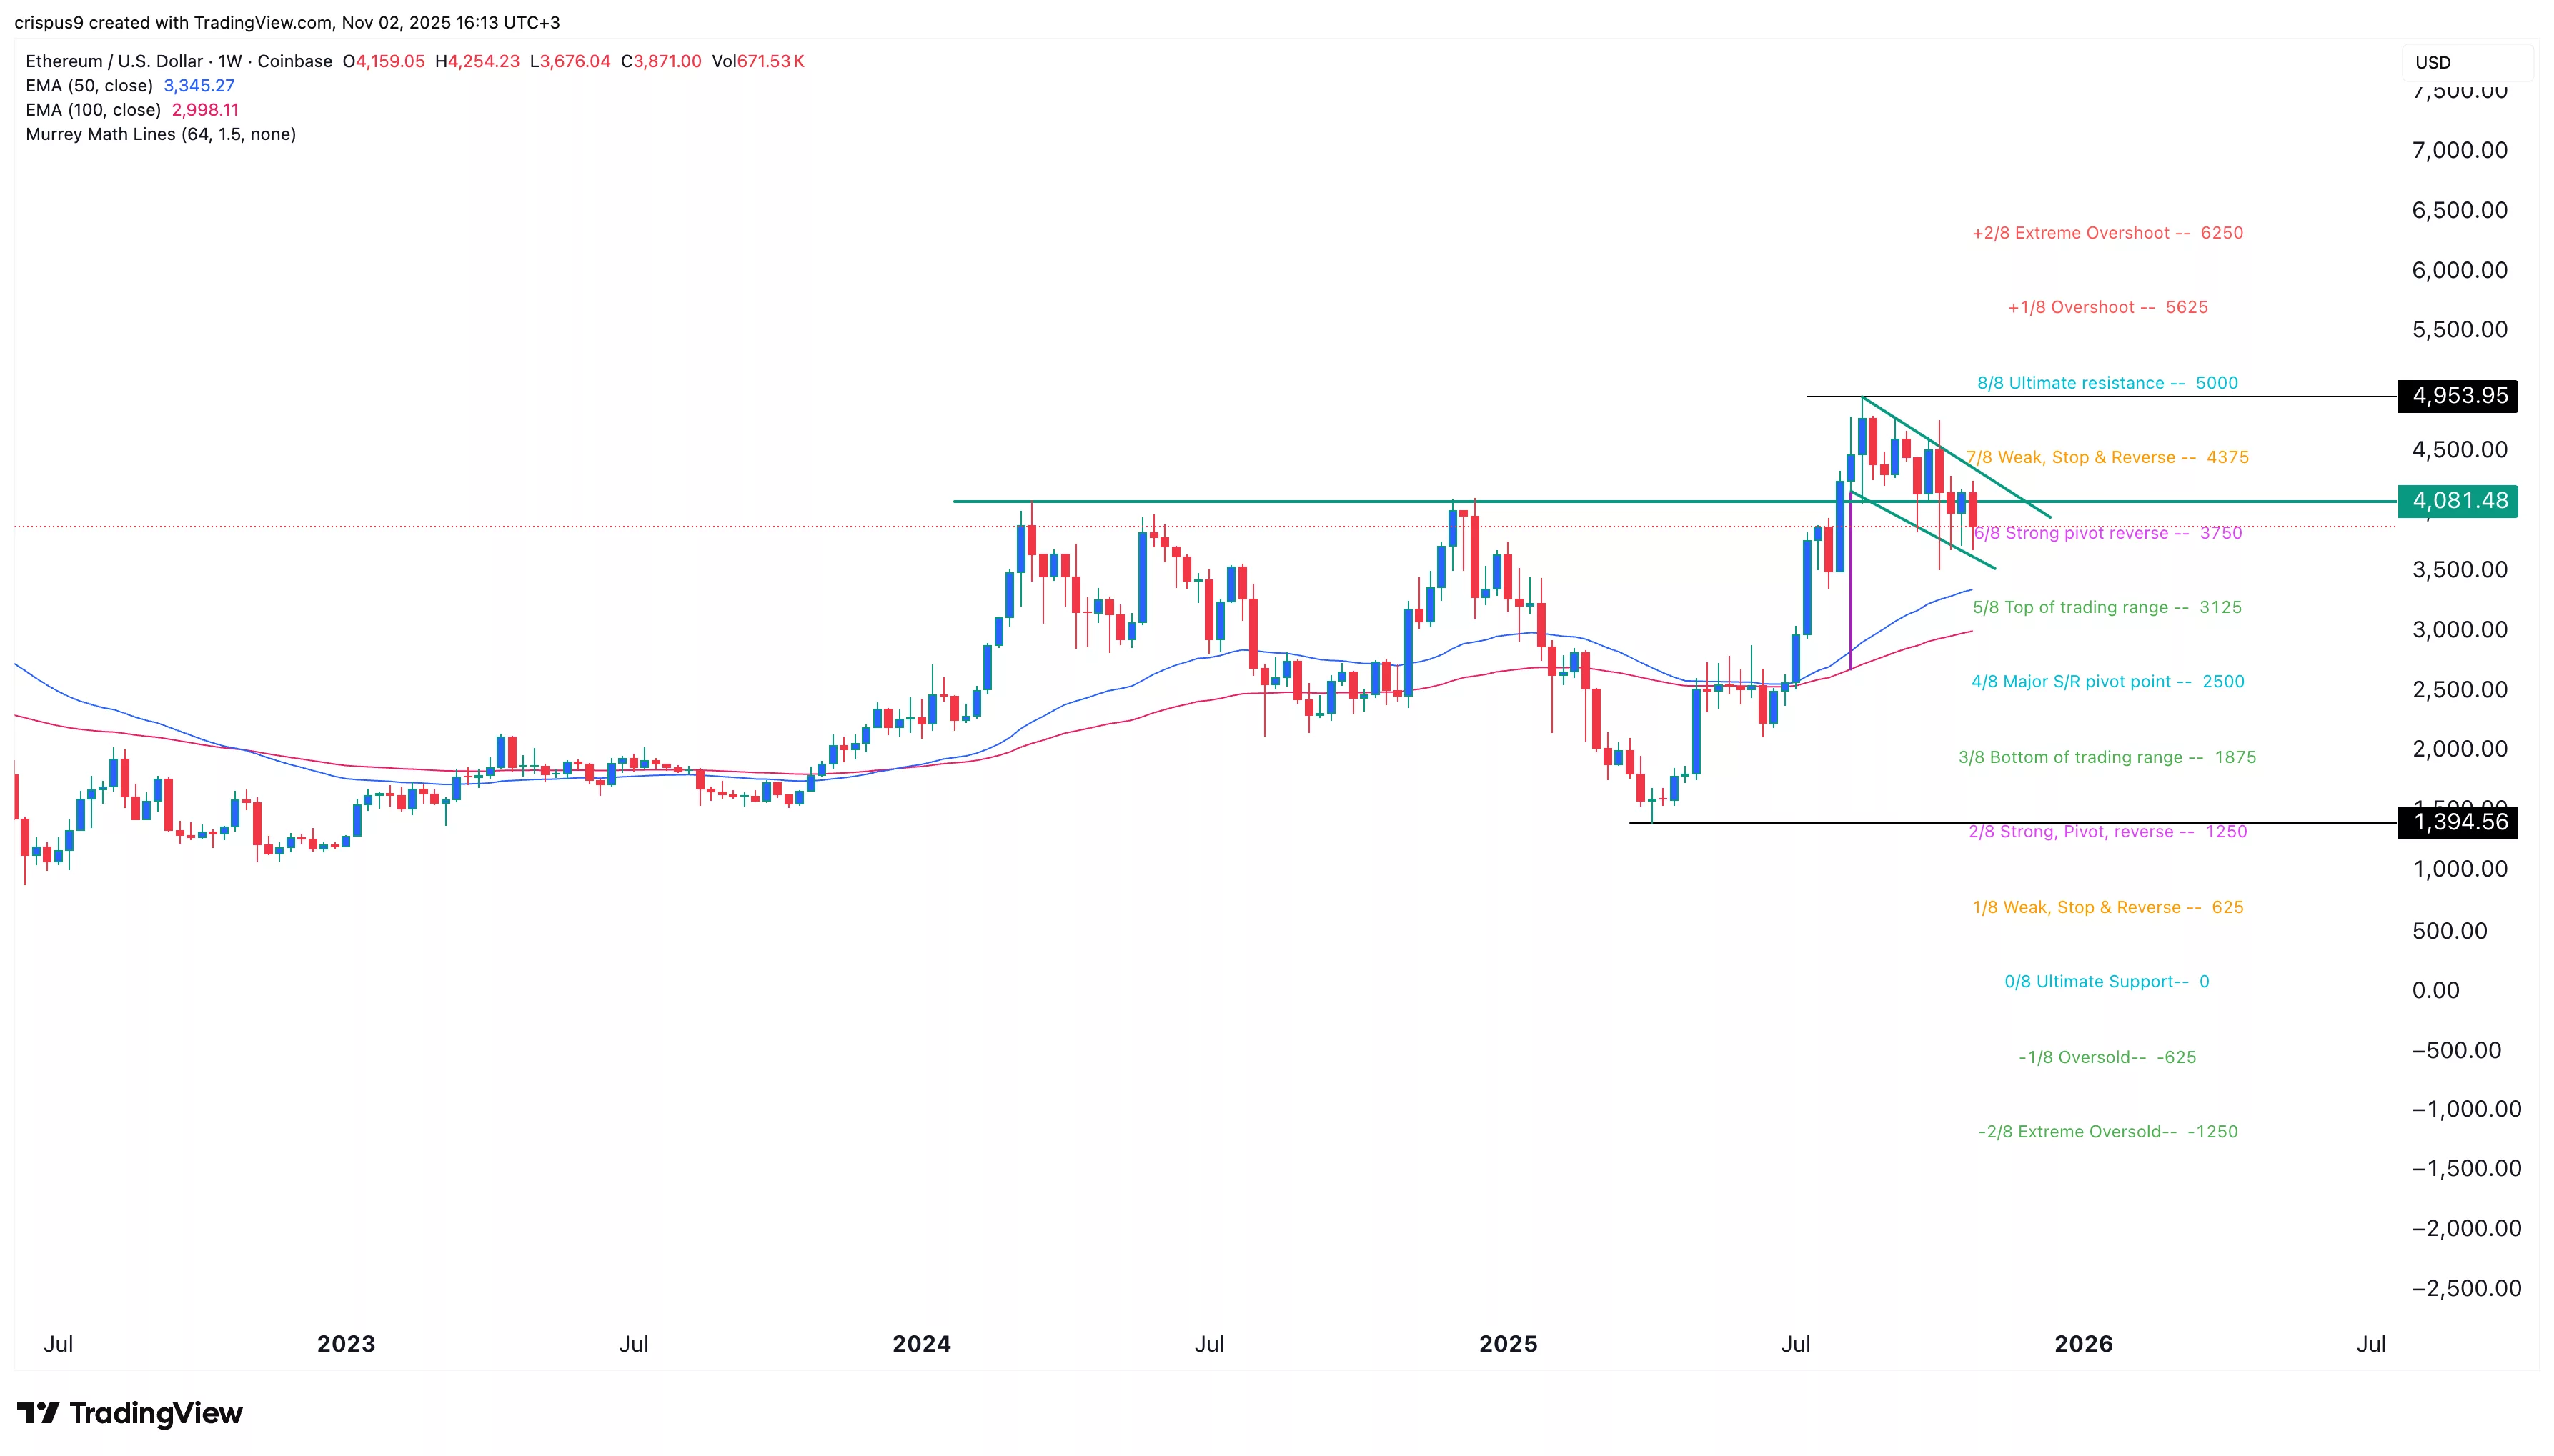
The weekly chart shows that the ETH price has rebounded from a low of $1,394 in April to a high of $4,953 in September. It has remained above the 50-week and 100-week Exponential Moving Averages, which formed a bullish crossover in June.
Ethereum price has also formed a bullish flag pattern, which is made up of a vertical line and a descending channel. It also retested the critical support level at $4,080, the highest point in March and December last year.
ETH’s price is also in the second phase of the Elliot Wave pattern, followed by the bullish third phase.
Therefore, the most likely scenario is a rebound, potentially to the ultimate resistance of the Murrey Math Lines at $5,000.
Crypto Treasuries Chase A New Kind Of Capital
There is a peculiar irony at the heart of the crypto treasury movement. Companies that staked their futures on digital a... Read more
What Strategy's Bitcoin Sale Really Tells Us
There is a moment in every bull run when the narrative starts to fray. Not with a crash, not with a scandal, but with so... Read more
The Clock Is Ticking On UK Stablecoins
The world is not waiting for Britain to make up its mind. While the United States and the European Union have spent the ... Read more
From Cypherpunk To Citadel
How Crypto Moved from the Wild West to the Mainstream Financial SystemA long-form analysis of Bitcoin's journey from fri... Read more
Tether Plots Global Expansion
Stablecoin leader seeks to transform itself from crypto plumbing provider into a broad “freedom tech” conglomerateTe... Read more
World Liberty Seeks Federal Trust Charter
World Liberty Financial, the crypto venture backed by the Trump family, has applied for a US national bank trust charter... Read more