
Ethereum Price Forms A Risky Pattern As Network Fees, ETF Inflows Slump

Ethereum price was stuck below the psychological point at $3,000 as exchange-traded fund inflows slowed and transaction fees in the network plunged.
Summary
- Ethereum price has formed several bearish patterns on the daily chart.
- The network fees have slumped by 57% in the last 30 days.
- The ETH ETF inflows have also slumped in the past two months.
Ethereum (ETH) was trading at $2,945, down by 40% from its highest point this year. It has also formed a risky pattern, pointing to more downside in the near term.
SoSoValue data shows that demand for Ethereum ETFs has largely waned in the past few weeks. The network had over $38 million in outflows on Friday after shedding $52 million and $95 million in the previous two trading days.
These funds experienced $102 million in outflows last week after shedding $643 million in the previous week. Most importantly, this was the second consecutive month of outflows.
Meanwhile, Nansen data shows that the network is making less money in terms of fees. Ethereum network made $11.1 million in fees in the last 30 days, down by 57% from the same period.
This decline happened after the Fusaka upgrade and as activity in the network slowed. For example, data compiled by DeFi LLama data shows that the network’s DEX volume dropped to $44 billion in December.
The volume has dropped for four consecutive months and is now at its lowest level since October last year. It peaked at over $126 billion in August this year.
On the positive side, BitMine has started staking its huge Ethereum hoard, a move it expects will start making it millions of dollars in returns annually. The new staking inflows will help to offset the outflows, which jumped to nearly $90 million in the last 30 days.
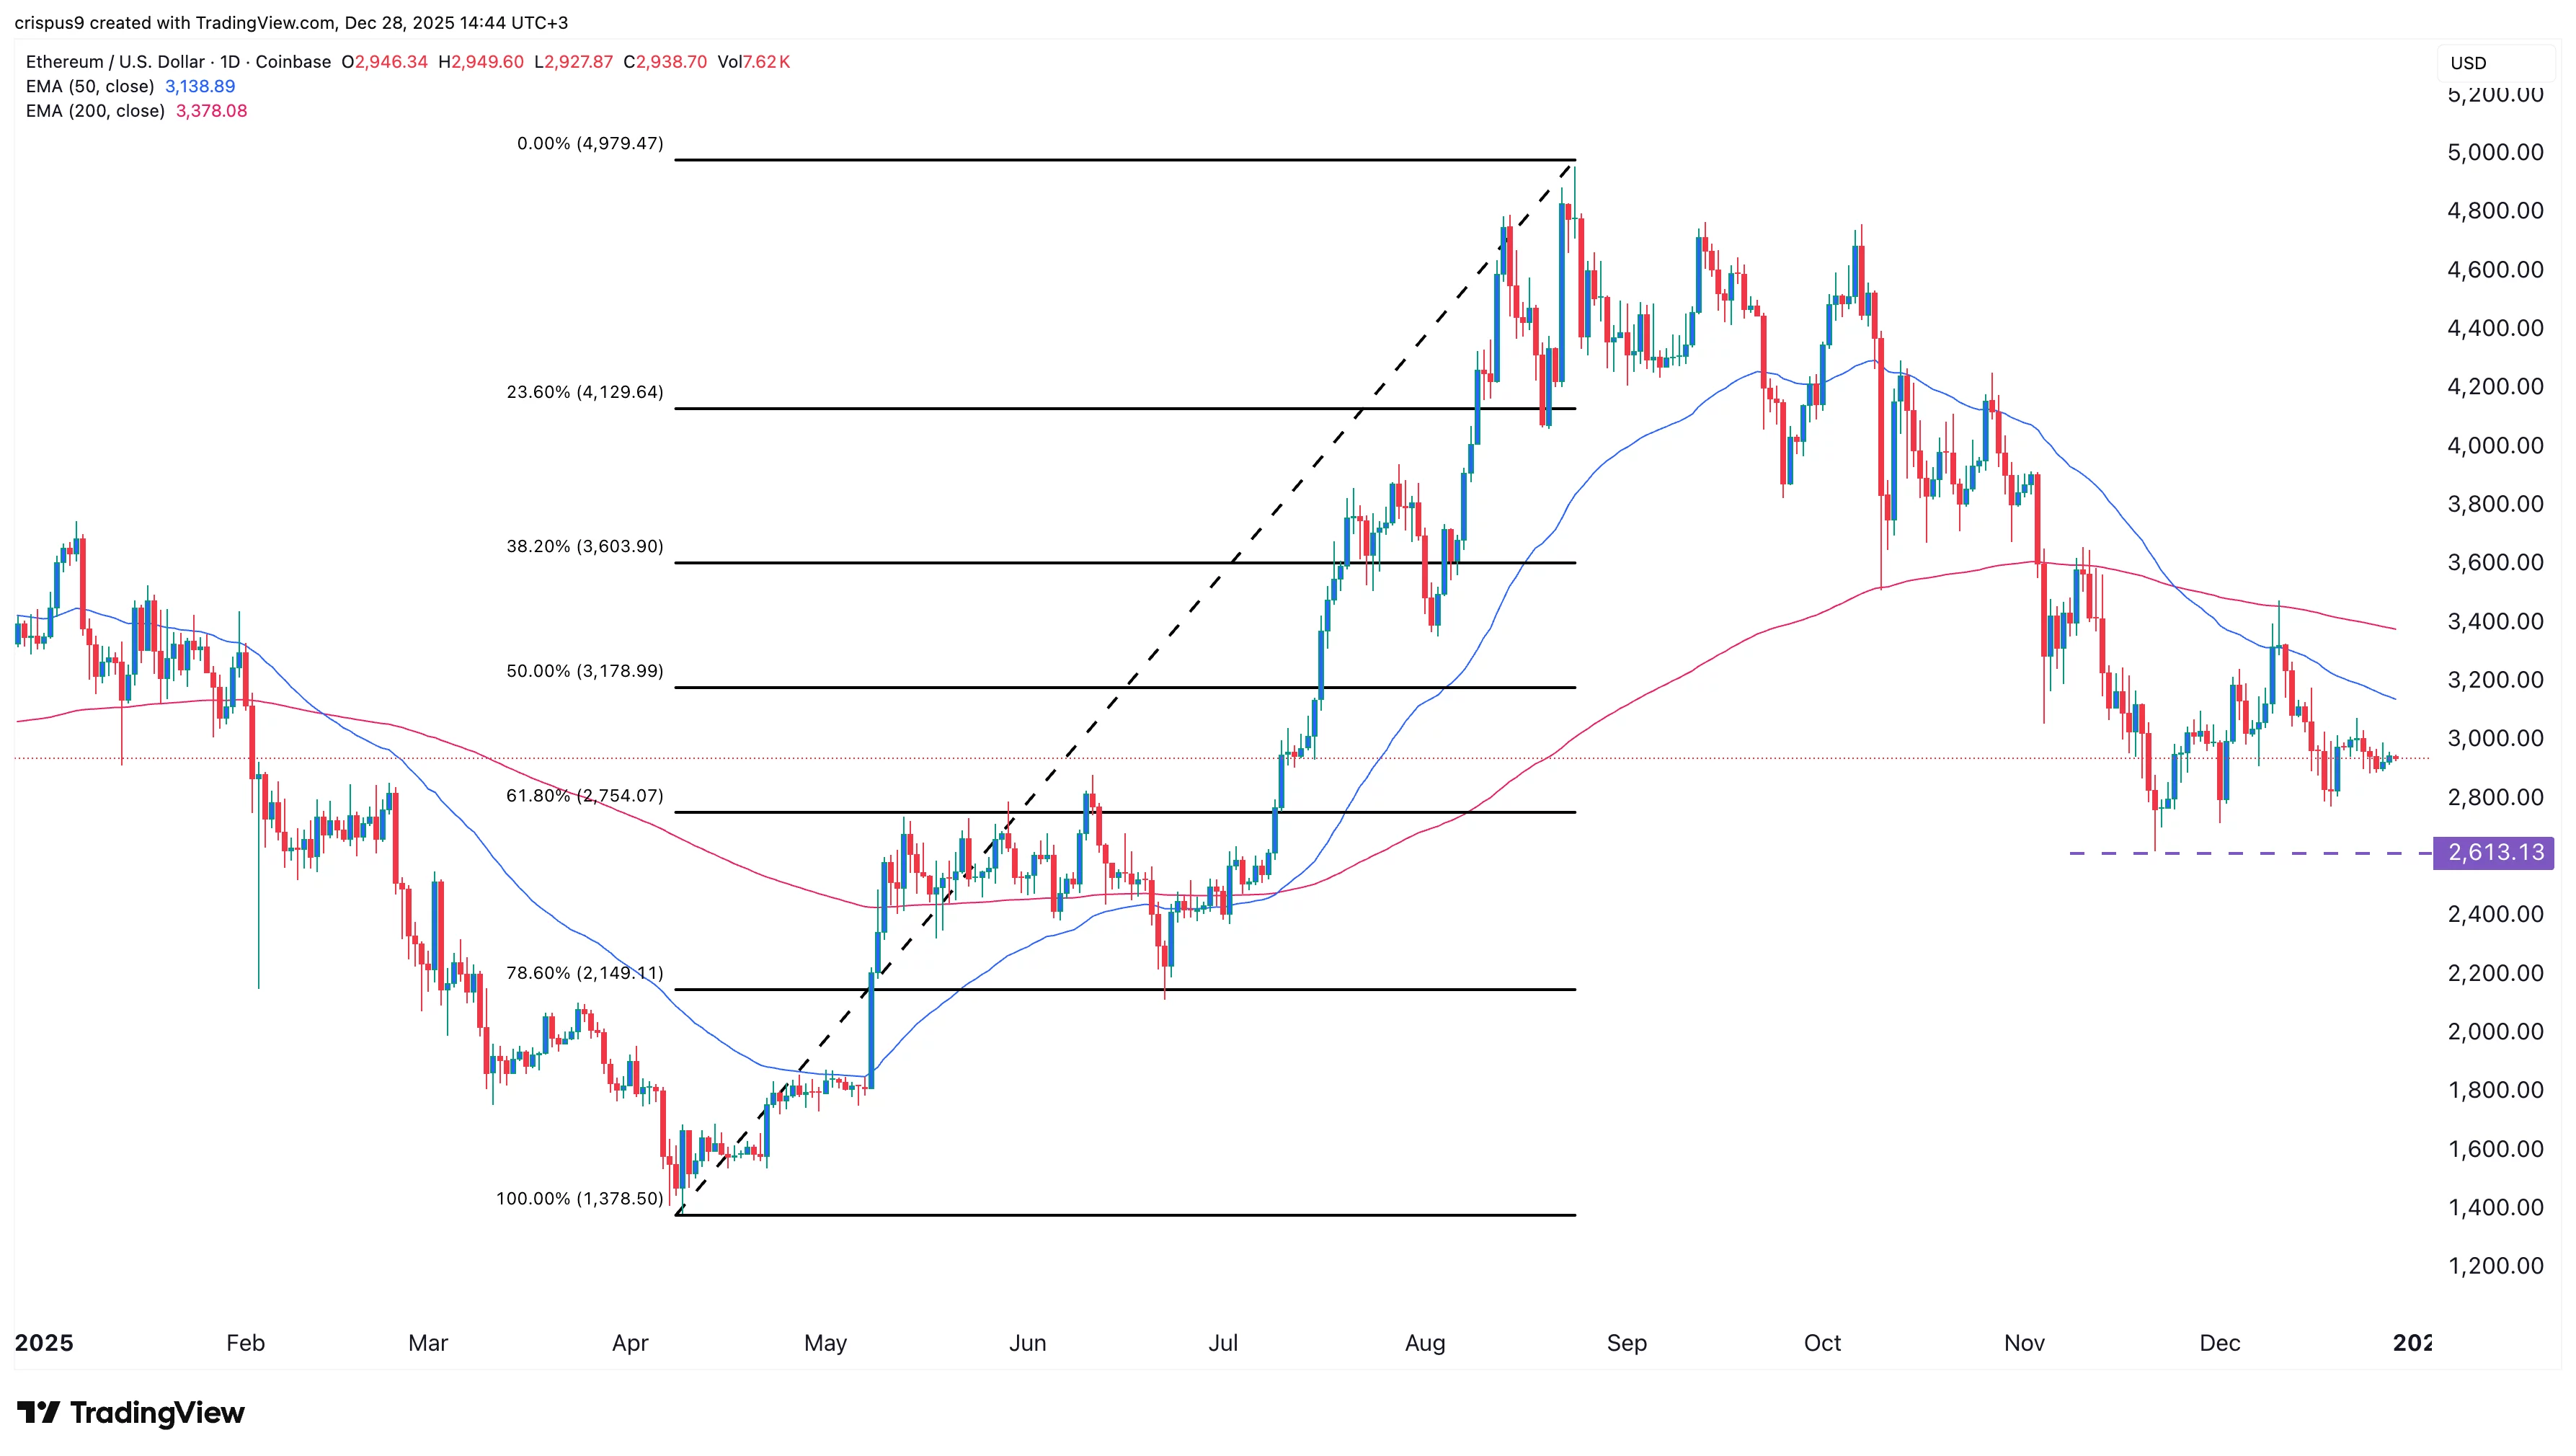
The daily timeframe chart shows that the ETH price has been in a strong downtrend in the past few months. It has dropped from a high of $4,980 in August to the current $2,940.
ETH has formed a death cross pattern and is now in the process of forming a head-and-shoulders pattern. It has also formed a bearish pennant pattern and is below the Supertrend indicator.
Therefore, the most likely ETH price forecast is bearish, with the initial target being at $2,615, its lowest point in November. A drop below that level will point to more downside, potentially to the psychological point at $2,500.
Crypto Treasuries Chase A New Kind Of Capital
There is a peculiar irony at the heart of the crypto treasury movement. Companies that staked their futures on digital a... Read more
What Strategy's Bitcoin Sale Really Tells Us
There is a moment in every bull run when the narrative starts to fray. Not with a crash, not with a scandal, but with so... Read more
The Clock Is Ticking On UK Stablecoins
The world is not waiting for Britain to make up its mind. While the United States and the European Union have spent the ... Read more
From Cypherpunk To Citadel
How Crypto Moved from the Wild West to the Mainstream Financial SystemA long-form analysis of Bitcoin's journey from fri... Read more
Tether Plots Global Expansion
Stablecoin leader seeks to transform itself from crypto plumbing provider into a broad “freedom tech” conglomerateTe... Read more
World Liberty Seeks Federal Trust Charter
World Liberty Financial, the crypto venture backed by the Trump family, has applied for a US national bank trust charter... Read more