
Ethereum Price Chart Points To A 16% Crash As Liquidations Near $1 Billion

Ethereum price retreated to the lowest level since August 6 as the recent crypto market crash continued and liquidations jumped.
Summary
- Ethereum price has crashed this week as liquidations soared.
- The weekly liquidations jumped to almost $1 billion.
- Technical analysis points to a 16% plunge in the near term.
Ethereum (ETH) fell to $3,800, down 20% from its highest point this month. Its decline has mirrored the performance of other top cryptocurrencies like Bitcoin (BTC) and Ripple (XRP).
Ethereum price crashed as liquidations jumped
One of the main reasons why ETH price plunged is that liquidations jumped to almost $1 billion this week. Bullish positions worth over $490 million were liquidated on Monday as the crypto market crash intensified.
Another $413 million in positions were liquidated on Friday, and about $50 million earlier in the week. Liquidations occur when exchanges close leveraged positions after margin or collateral is exhausted.
Ethereum price also crashed as exchange-traded outflows jumped. All spot Ethereum funds shed more than $547 million in assets after they added $556 million a week earlier. Rising outflows are a sign of waning demand among institutional investors in the United States.
The drop also followed profit-taking and renewed concerns about the Federal Reserve. Several officials, including Beth Hammack, John Williams, and Raphael Bostic, warned that additional rate cuts could make inflation stickier.
Inflation jitters increased on Thursday after Donald Trump announced more tariff measures. He plans to add tariffs on imported drugs, pharmaceuticals, and other items such as furniture.
Still, Ethereum has some potential bullish catalysts, including the possible entry of Vanguard into the crypto industry, the upcoming Fusaka upgrades, and the start of retirement fund investments in crypto.
ETH price technical analysis
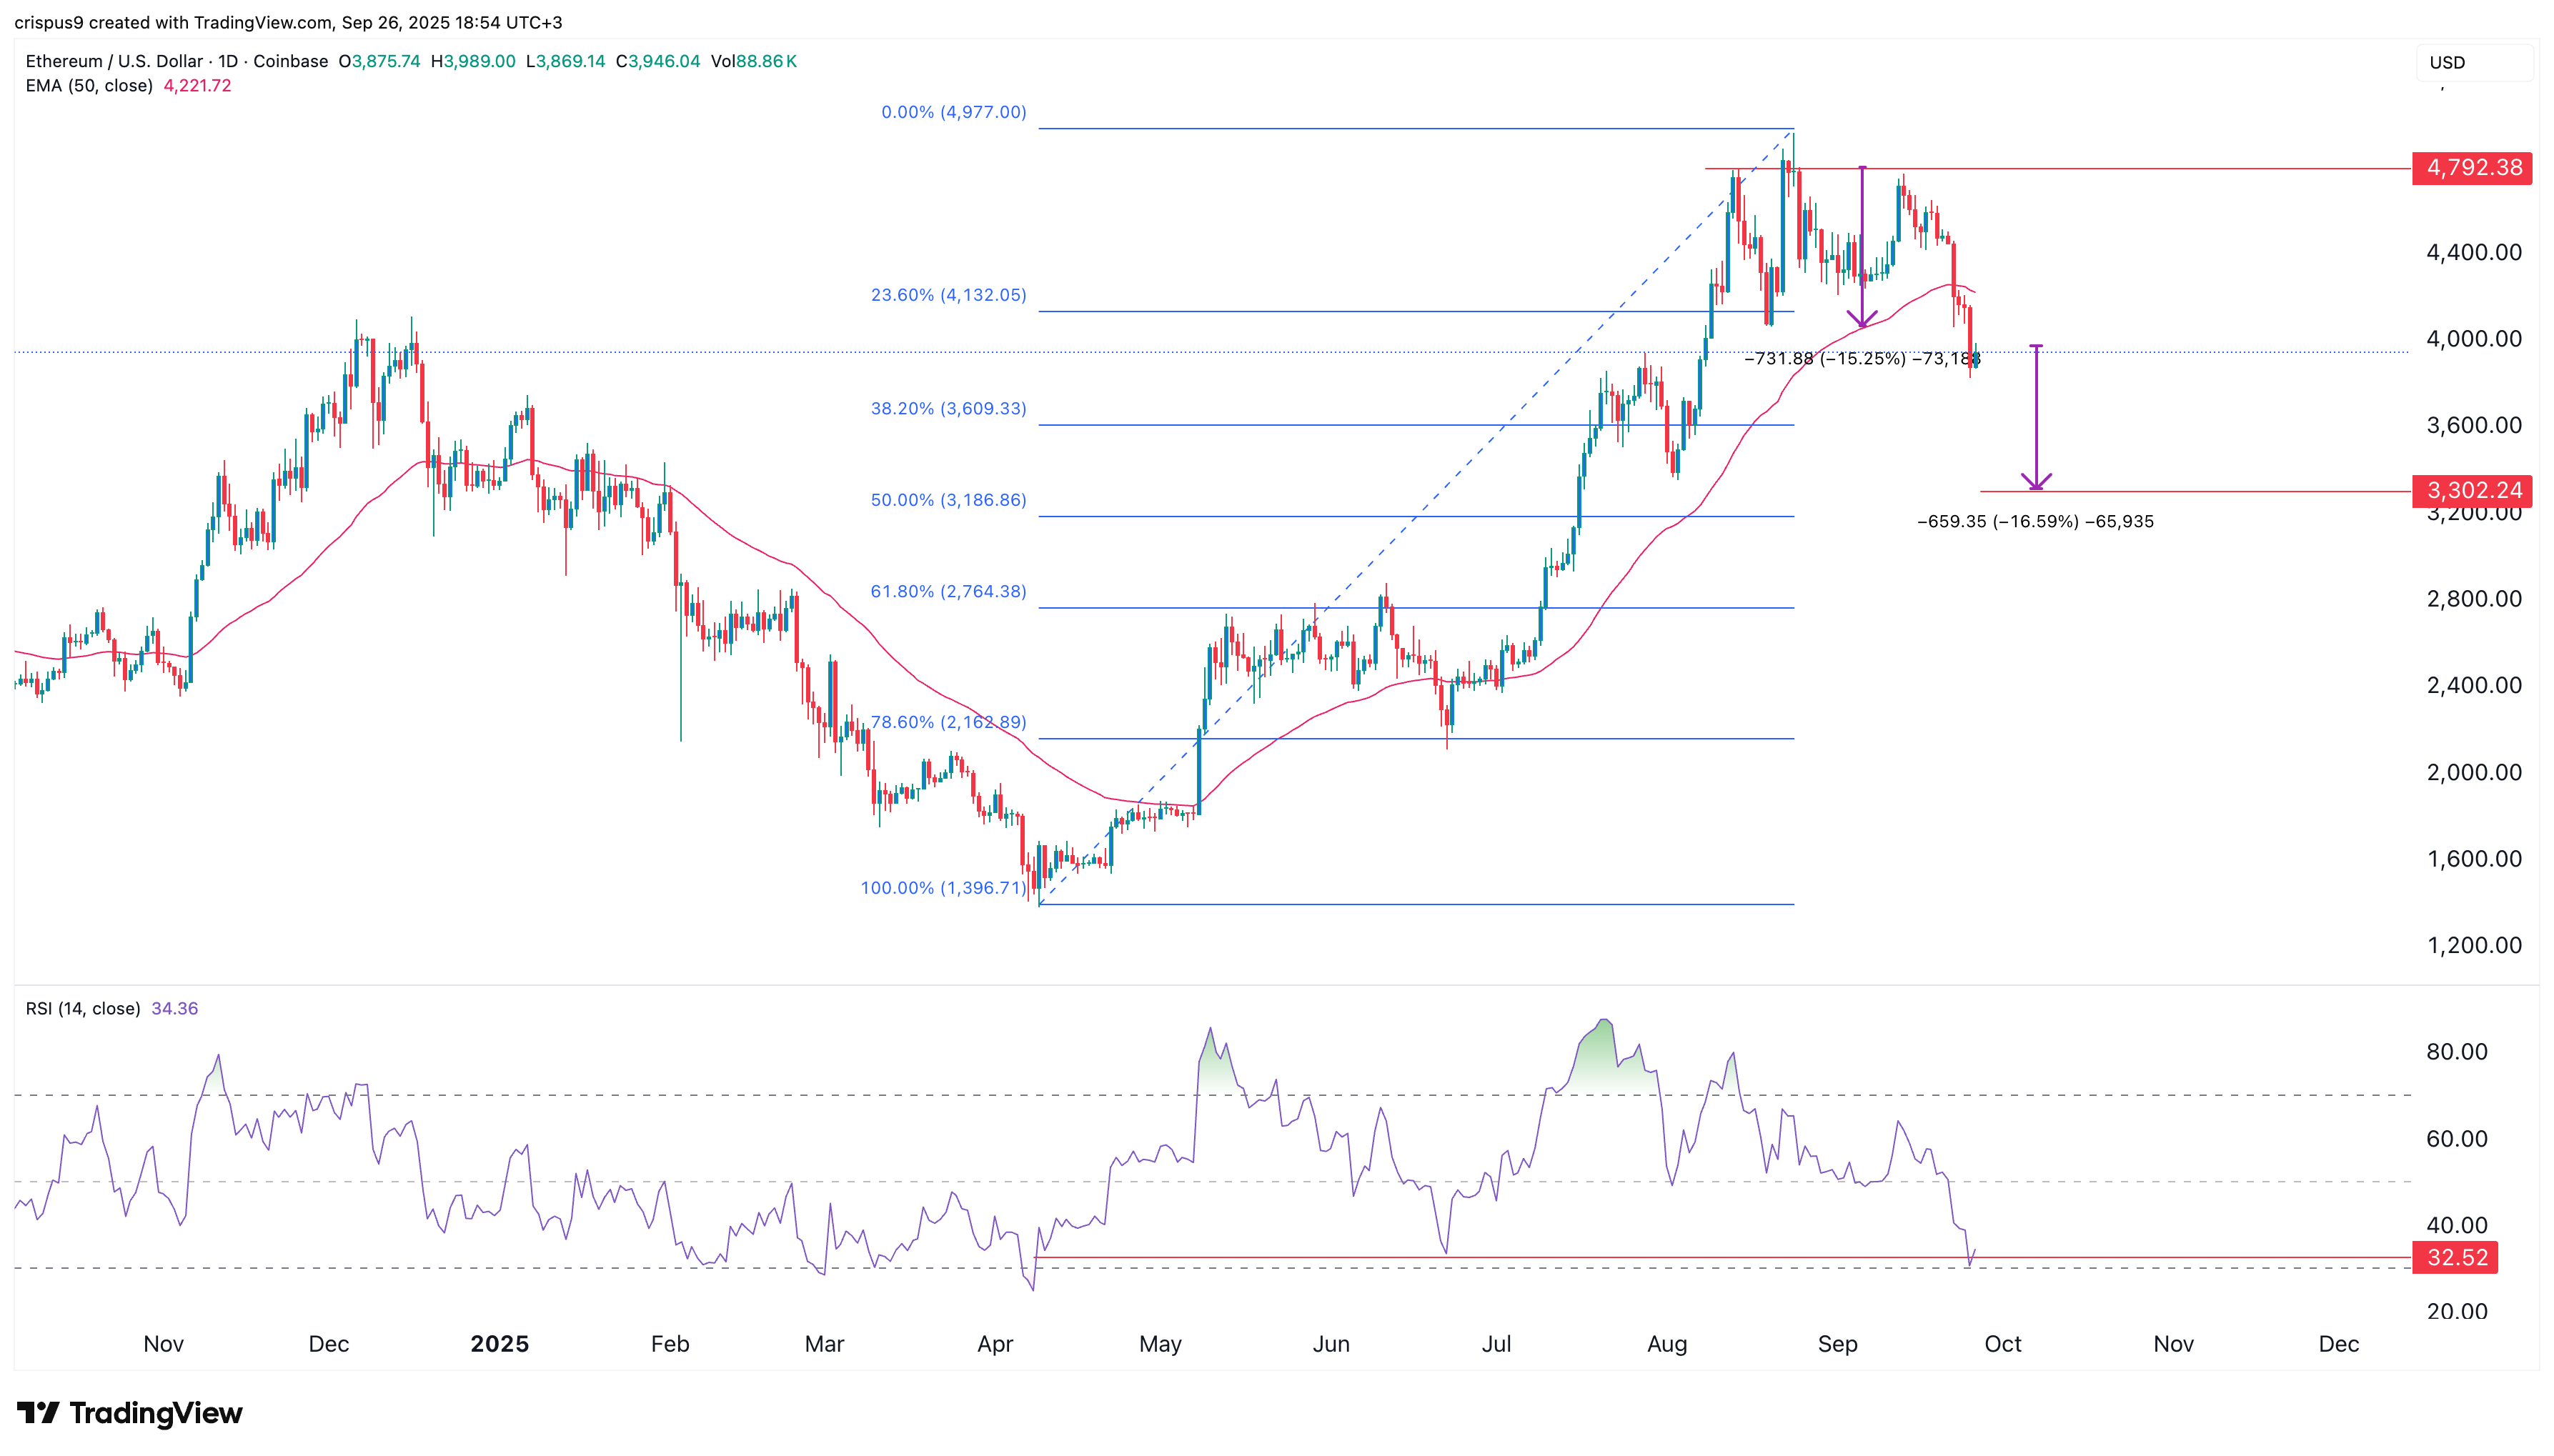
The daily timeframe chart shows that Ethereum pulled back from this month’s high of $4,978 to below $4,000 today.
It has moved below the 23.6% Fibonacci retracement level and the 50-day exponential moving average.
The decline followed the formation of a triple-top pattern with a neckline at the 23.6% retracement level. The distance between the triple-top point and the neckline is about 15%.
Measuring the same distance from the neckline points to a drop to $3,300, which coincides with the 50% retracement level. The bearish forecast will become invalid if price moves above resistance at $4,400.
Crypto Treasuries Chase A New Kind Of Capital
There is a peculiar irony at the heart of the crypto treasury movement. Companies that staked their futures on digital a... Read more
What Strategy's Bitcoin Sale Really Tells Us
There is a moment in every bull run when the narrative starts to fray. Not with a crash, not with a scandal, but with so... Read more
The Clock Is Ticking On UK Stablecoins
The world is not waiting for Britain to make up its mind. While the United States and the European Union have spent the ... Read more
From Cypherpunk To Citadel
How Crypto Moved from the Wild West to the Mainstream Financial SystemA long-form analysis of Bitcoin's journey from fri... Read more
Tether Plots Global Expansion
Stablecoin leader seeks to transform itself from crypto plumbing provider into a broad “freedom tech” conglomerateTe... Read more
World Liberty Seeks Federal Trust Charter
World Liberty Financial, the crypto venture backed by the Trump family, has applied for a US national bank trust charter... Read more