
Ethereum Price At Risk Of A Pullback Despite Solid Fundamentals

Ethereum price rally lost momentum this week, moving from a high of $3,387 on January 13 to the current $3,288 as concerns about the Market Structure Bill rose.
Summary
- ETH price has pulled back in the past few days as demand for cryptocurrencies waned.
- Ethereum has encouraging fundamentals, including higher network activity.
- The token has formed a rising wedge chart pattern on the daily chart.
Ethereum (ETH) token has dropped by 33% from its highest level in August last year, mirroring the performance of the broader crypto market.
The token has pulled back despite its strong fundamentals. For example, data compiled by SoSoValue shows that spot Ethereum ETFs have added over $584 million in inflows this year, bringing the cumulative total net inflows to over $12.9 billion. All these funds have over $20 billion in assets, with BlackRock’s ETHA having over $11.7 billion in assets.
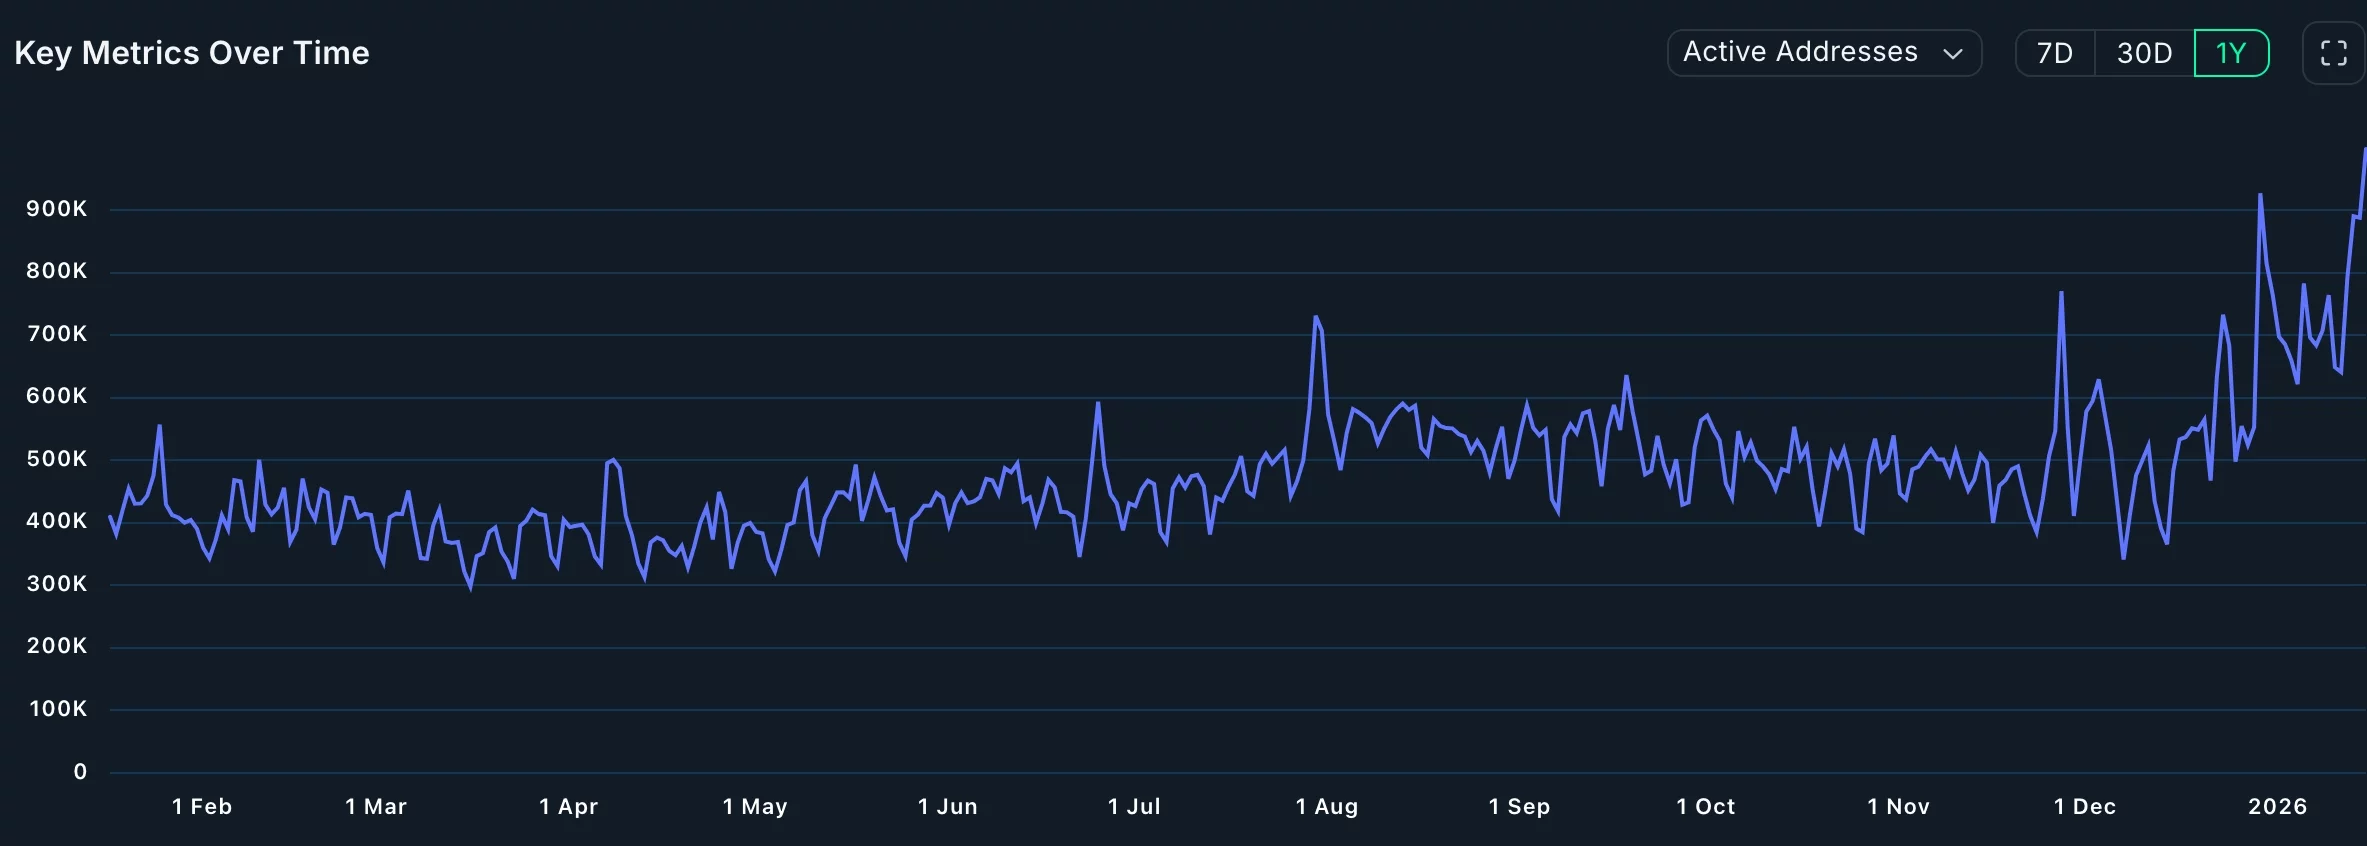
Ethereum’s network is also doing well, with the number of transactions and users continuing their growth momentum. The number of transactions rose by 30% to over 58 million in the last 30 days, while active addresses rose by 64% to 13.1 million.
Ethereum’s stablecoin transactions have continued soaring this year, with the supply of these tokens rising to $170 billion and the transaction volume rising to $977 billion in the last 30 days. The network’s stablecoin transactions rose to over 50.4 million.
More data shows that Ethereum investors are moving staking pools, where they are earning about 2.85% in annual returns. Data shows the staking market has jumped to over $118 billion, up by $1 billion in the last 30 days. BitMine has continued staking its huge Ethereum hoard, which is a bullish thing.
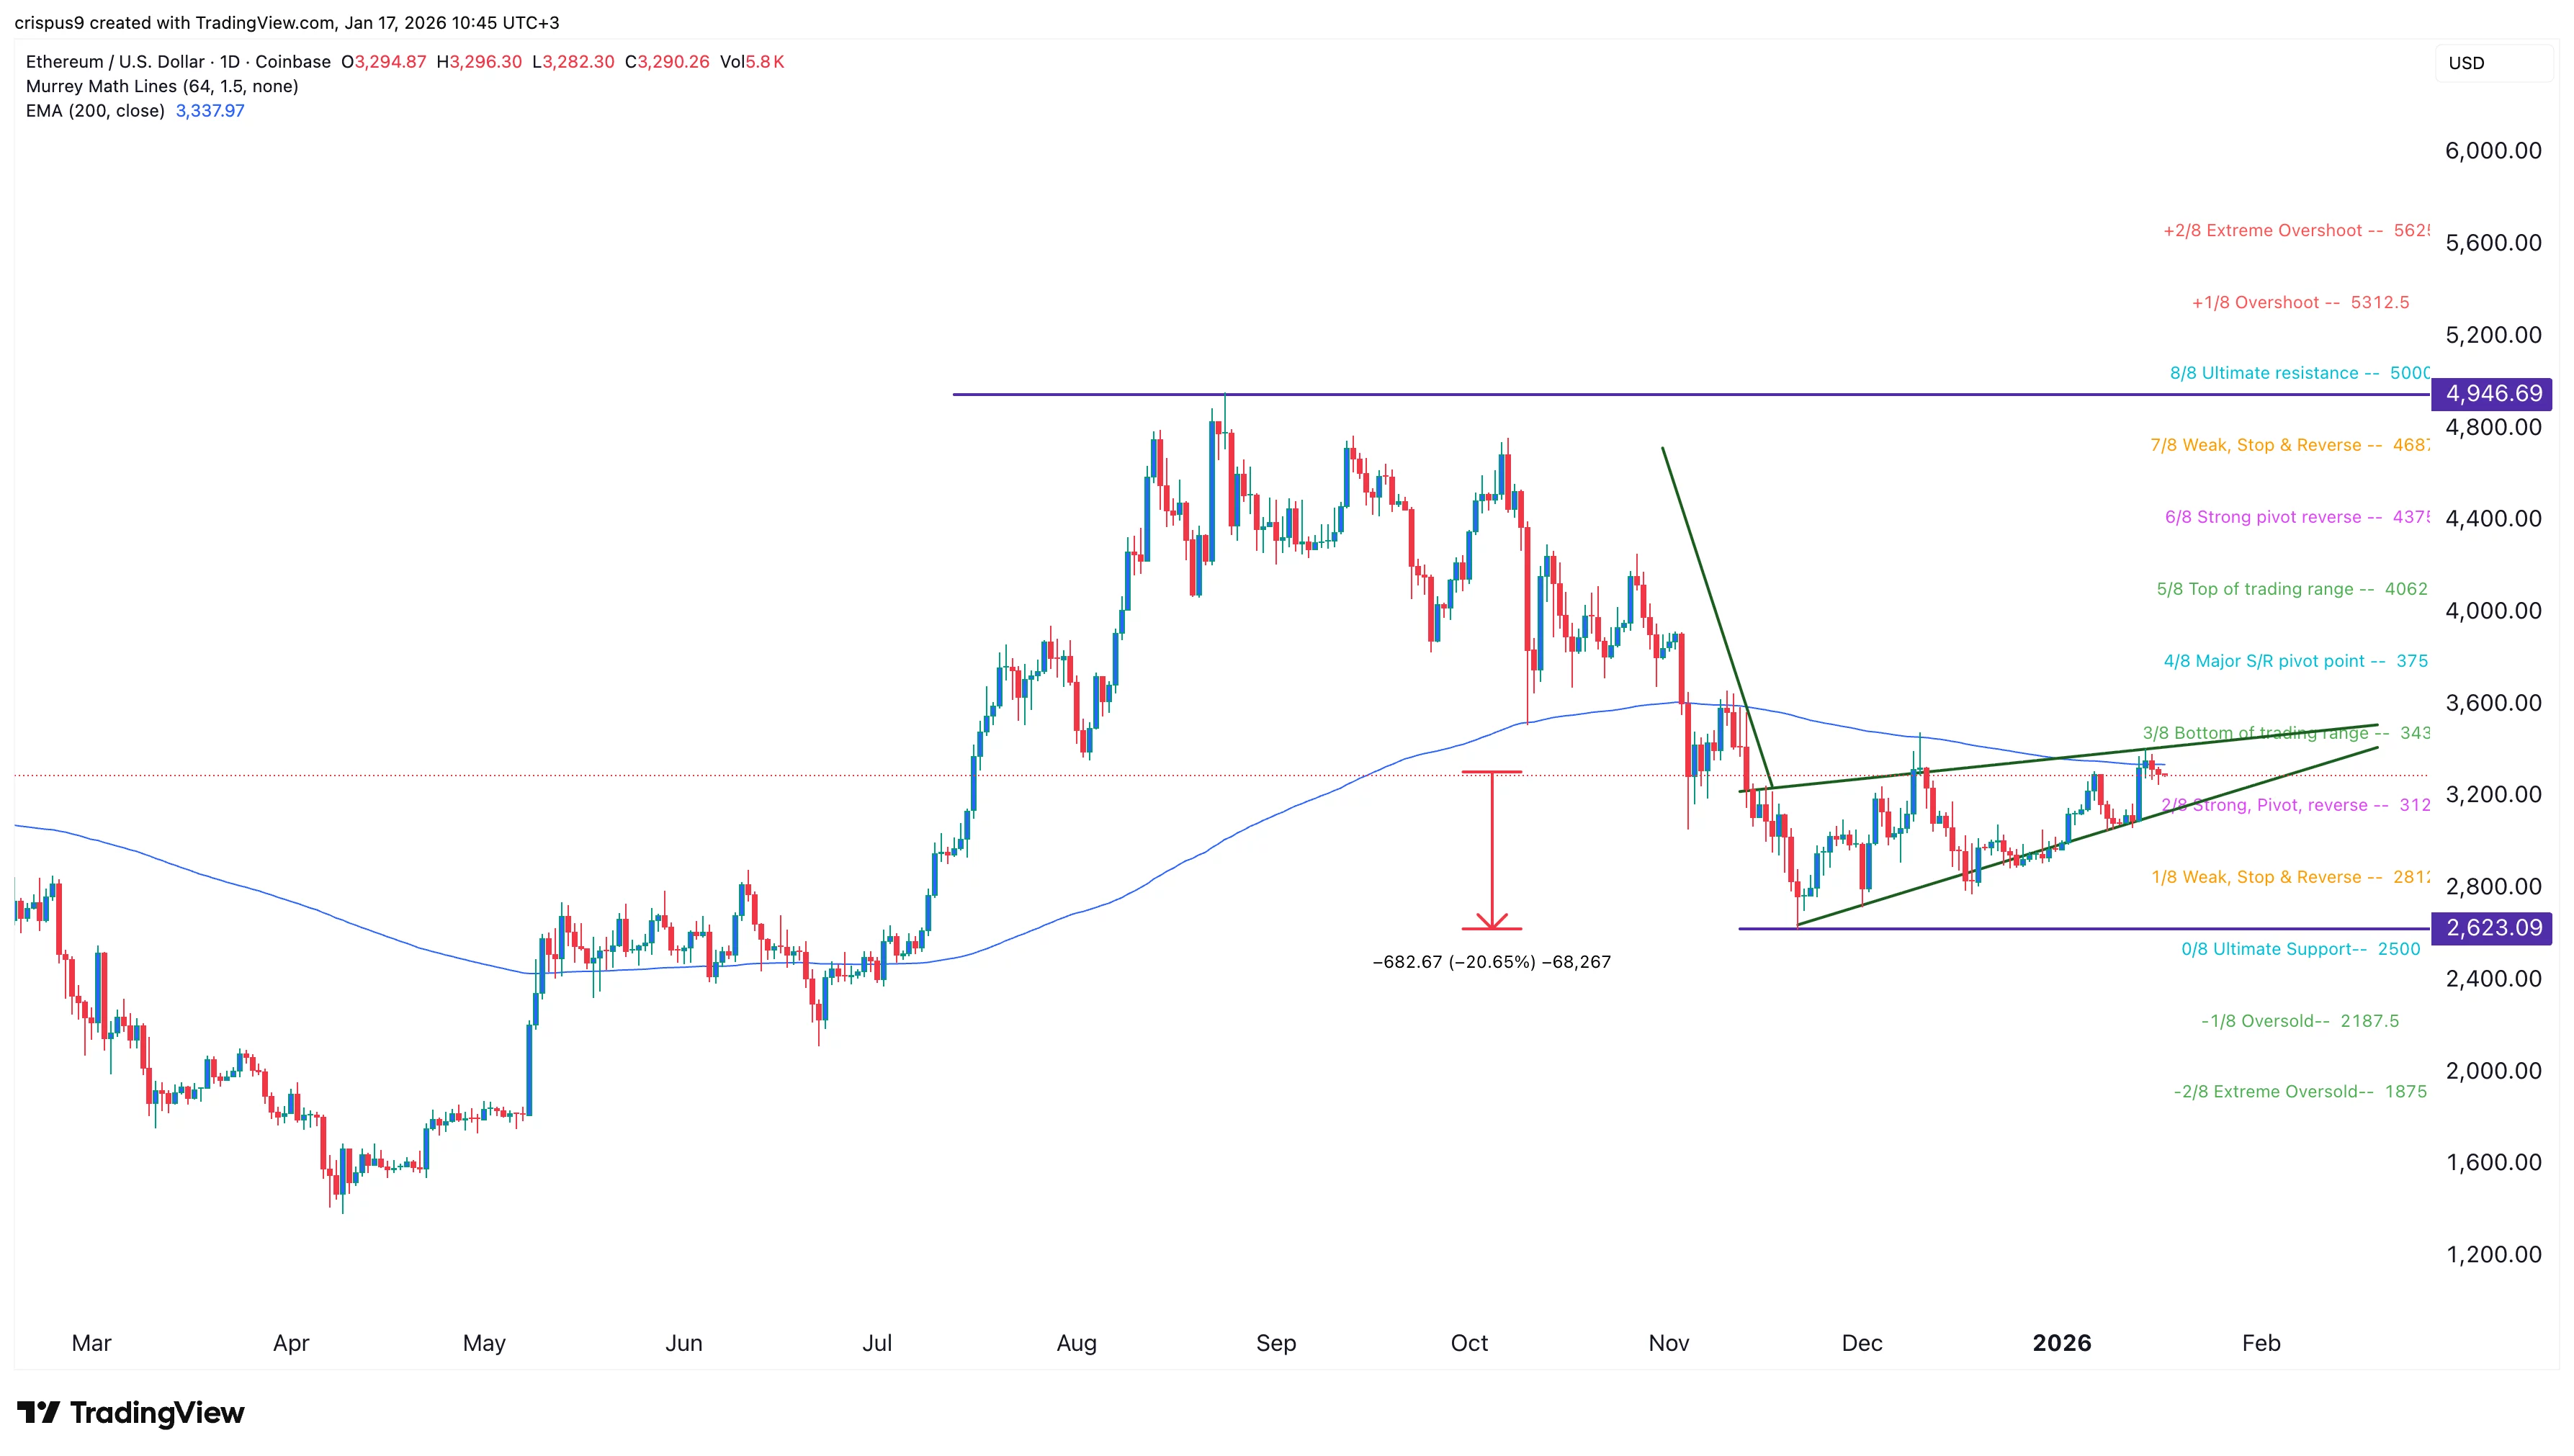
The daily timeframe chart shows that the Ethereum price has retreated from last year’s high of $4,946 in August to the current $3,290. It has failed to move above the 200-day Exponential Moving Average, a sign bulls are losing momentum.
The token has formed a rising wedge pattern, which is characterized by two ascending and converging trendlines. A wedge is one of the most common bearish reversal patterns.
It has also formed a bearish pennant and bearish divergence patterns. Therefore, the coin will likely have a strong bearish breakout, potentially to the key support level at $2,623, its lowest level on November 21. This target is about 20% below the current level.
On the flip side, a move above the key resistance level at $3,500 will invalidate the bullish outlook and point to more upside.
Crypto Treasuries Chase A New Kind Of Capital
There is a peculiar irony at the heart of the crypto treasury movement. Companies that staked their futures on digital a... Read more
What Strategy's Bitcoin Sale Really Tells Us
There is a moment in every bull run when the narrative starts to fray. Not with a crash, not with a scandal, but with so... Read more
The Clock Is Ticking On UK Stablecoins
The world is not waiting for Britain to make up its mind. While the United States and the European Union have spent the ... Read more
From Cypherpunk To Citadel
How Crypto Moved from the Wild West to the Mainstream Financial SystemA long-form analysis of Bitcoin's journey from fri... Read more
Tether Plots Global Expansion
Stablecoin leader seeks to transform itself from crypto plumbing provider into a broad “freedom tech” conglomerateTe... Read more
World Liberty Seeks Federal Trust Charter
World Liberty Financial, the crypto venture backed by the Trump family, has applied for a US national bank trust charter... Read more