
Bitcoin Price Prediction: Will Chinese New Year Trigger A BTC Selloff Tomorrow?

Bitcoin price is hovering around $68,500 as traders watch for potential volatility around Chinese New Year, a period that has historically coincided with short-term shifts in crypto liquidity.
Summary
- Bitcoin is trading around $68,500 ahead of Chinese New Year, a period that has historically seen mixed crypto performance, with some years showing pre-holiday weakness.
- Coinbase CEO Brian Armstrong said retail users are “buying the dip,” with February BTC and ETH balances equal to or higher than December levels.
- Technically, BTC remains below its 50-day SMA near $83,900, with support at $65,000 and $60,000–$62,000, and resistance around $72,000 and $76,000–$80,000.
Chinese New Year effect — seasonal pressure or coincidence?
Chinese New Year has at times aligned with weakness in Bitcoin (BTC) and broader crypto markets.
The theory is that traders in Asia may reduce exposure ahead of the holiday to free up cash, leading to temporary selling pressure. In some past cycles, BTC saw pullbacks in the days leading into Lunar New Year.
However, the pattern is far from consistent. There have also been years where Bitcoin rallied shortly after the holiday period. Crypto markets today are also more globally distributed than in earlier cycles, reducing the likelihood that one regional holiday alone drives price direction.
Adding another layer, Coinbase CEO Brian Armstrong recently said retail users on the exchange are “buying the dip.”
According to his data, retail BTC and ETH balances in February are equal to or higher than December levels, suggesting long-term holders are accumulating rather than capitulating.
If that trend holds, it could cushion any seasonal selling.
What Bitcoin price analysis shows
On the daily chart, BTC remains below its 50-day simple moving average near $83,900, confirming that the short-term trend is still bearish.
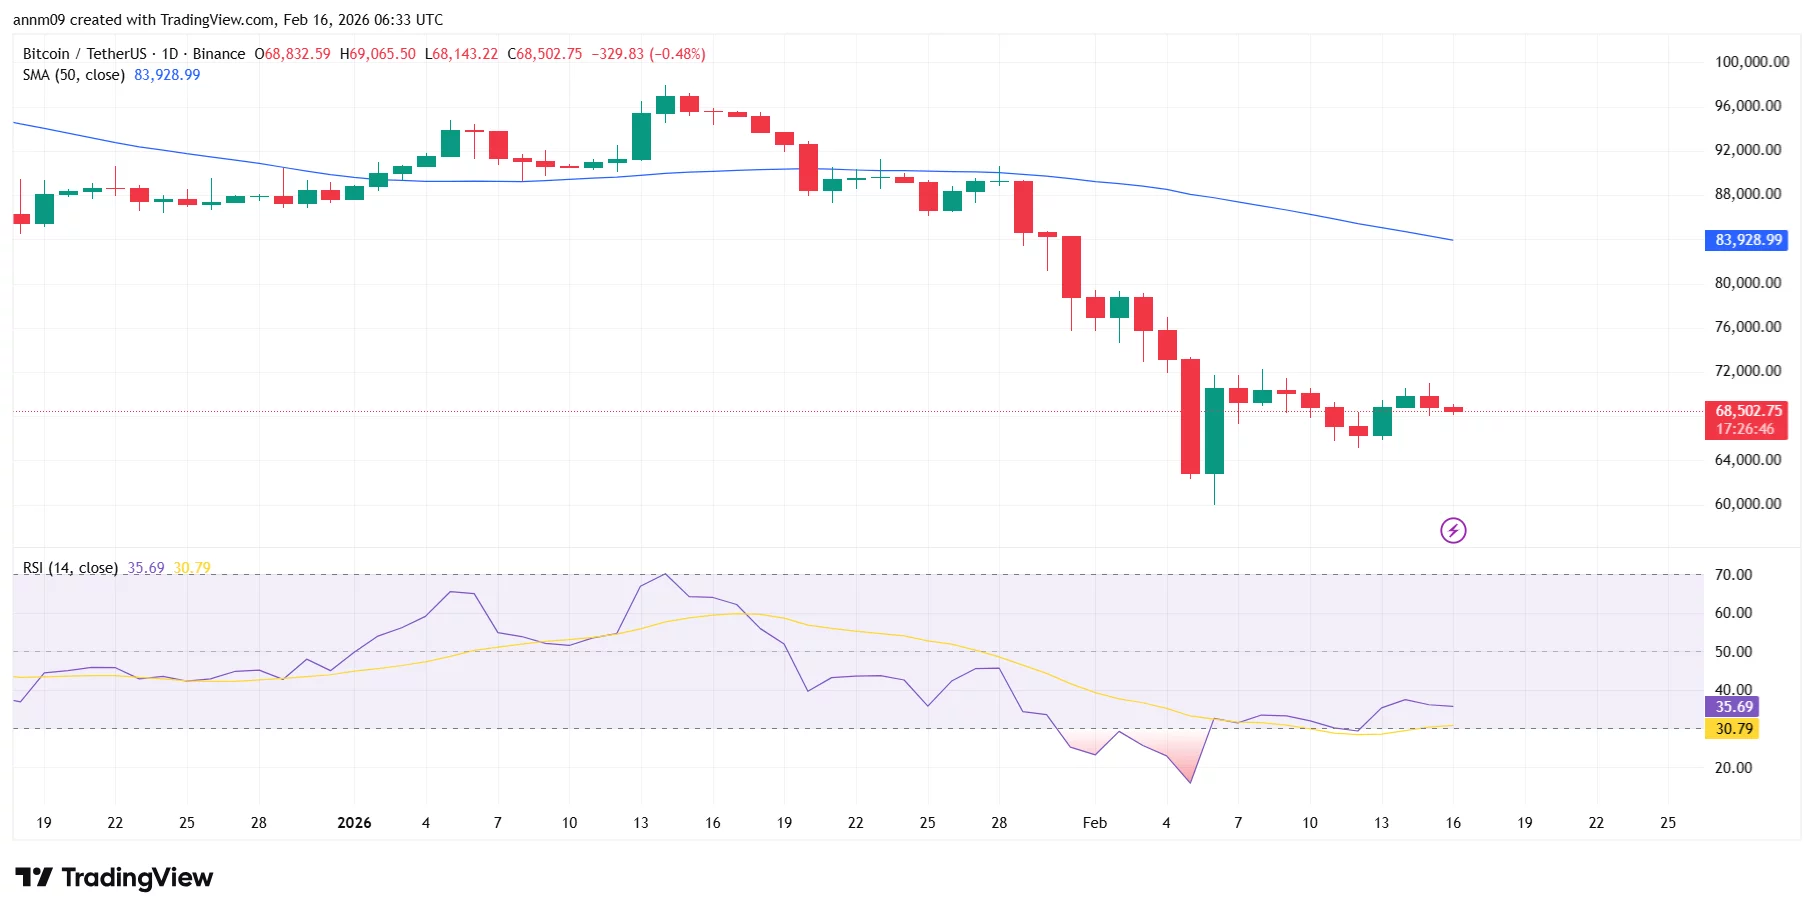
Price has formed a series of lower highs since topping near the mid-$90,000 range in January.
The Relative Strength Index (RSI) sits around 35, recovering from deeply oversold levels near 20 earlier this month. That rebound suggests selling momentum has cooled, but it does not yet confirm a trend reversal.
Immediate support is near $65,000, with stronger support in the $60,000–$62,000 zone, where a sharp capitulation wick formed earlier in February. Resistance stands near $72,000, followed by a heavier supply zone between $76,000 and $80,000.
A break below $65,000 could reopen downside risk toward $60,000. A decisive move above $72,000 would be the first sign that bulls are regaining control, regardless of seasonal narratives.
Crypto Treasuries Chase A New Kind Of Capital
There is a peculiar irony at the heart of the crypto treasury movement. Companies that staked their futures on digital a... Read more
What Strategy's Bitcoin Sale Really Tells Us
There is a moment in every bull run when the narrative starts to fray. Not with a crash, not with a scandal, but with so... Read more
The Clock Is Ticking On UK Stablecoins
The world is not waiting for Britain to make up its mind. While the United States and the European Union have spent the ... Read more
From Cypherpunk To Citadel
How Crypto Moved from the Wild West to the Mainstream Financial SystemA long-form analysis of Bitcoin's journey from fri... Read more
Tether Plots Global Expansion
Stablecoin leader seeks to transform itself from crypto plumbing provider into a broad “freedom tech” conglomerateTe... Read more
World Liberty Seeks Federal Trust Charter
World Liberty Financial, the crypto venture backed by the Trump family, has applied for a US national bank trust charter... Read more