
Bitcoin Price Crashes Ahead Of Options Expiry As A Risky Pattern Forms

Bitcoin price is on track to drop for three consecutive weeks as traders brace for a $15 billion options expiry and as risky chart patterns form on the weekly chart.
Summary
- Bitcoin price has crashed for three consecutive weeks.
- BTC and Ethereum options worth over $15 billion will expire today.
- Technical analysis points to more BTC price dips.
Bitcoin (BTC) price plunged to $108,000 on Friday, Aug. 29, down significantly from the all-time high of $124,200, and there is a risk that the downtrend could continue if it loses a key support.
Bitcoin price tumbles ahead of a key options expiry
Crypto and stocks often plunge or remain highly volatile ahead of a major options expiry. It is common for the stock market to plunge ahead of he triple-witching event when options of stocks and indices expire.
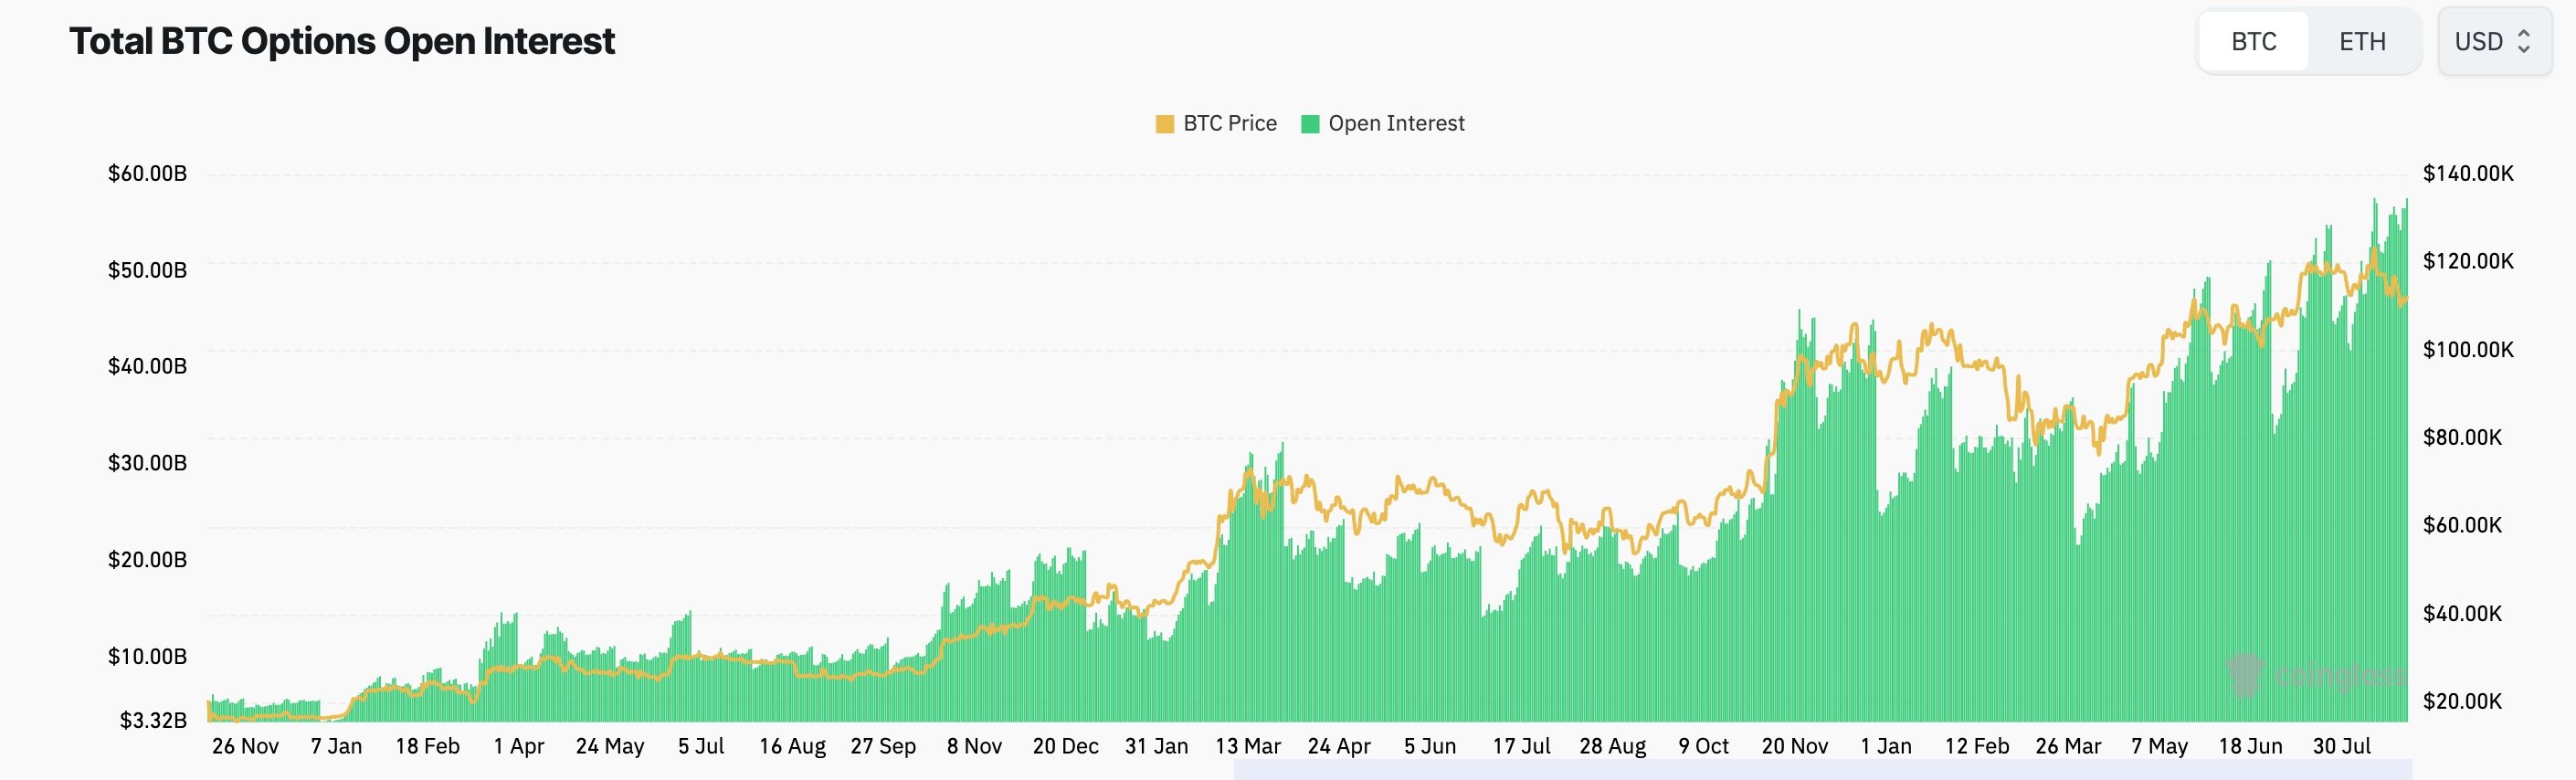
Bitcoin price is dropping as investors wait for a major options expiry worth over $15 billion. Data compiled by Deribit, one of the top derivatives exchanges, shows that short sellers target a Bitcoin dive to between $95,000 and $110,000.
More data by CoinGlass shows that options open interest has jumped in the last three days, reaching a high of $57 billion on Friday. A rising options open interest is common towards a major expiry.
Bitcoin price often rebounds a few days after the options expiry date, and this could happen soon as the weighted funding rate has remained positive in the past few months.
The risk this time is that the expiry is happening at a time when investors are embracing a risk-off sentiment. For example, the top indices like the Nasdaq 100 and the Dow Jones dropped by 1.10% and 0.35% on Friday, with Nvidia leading the losses. They also dropped after a report pointed to sticky consumer prices in the US.
BTC price risky chart pattern is concerning
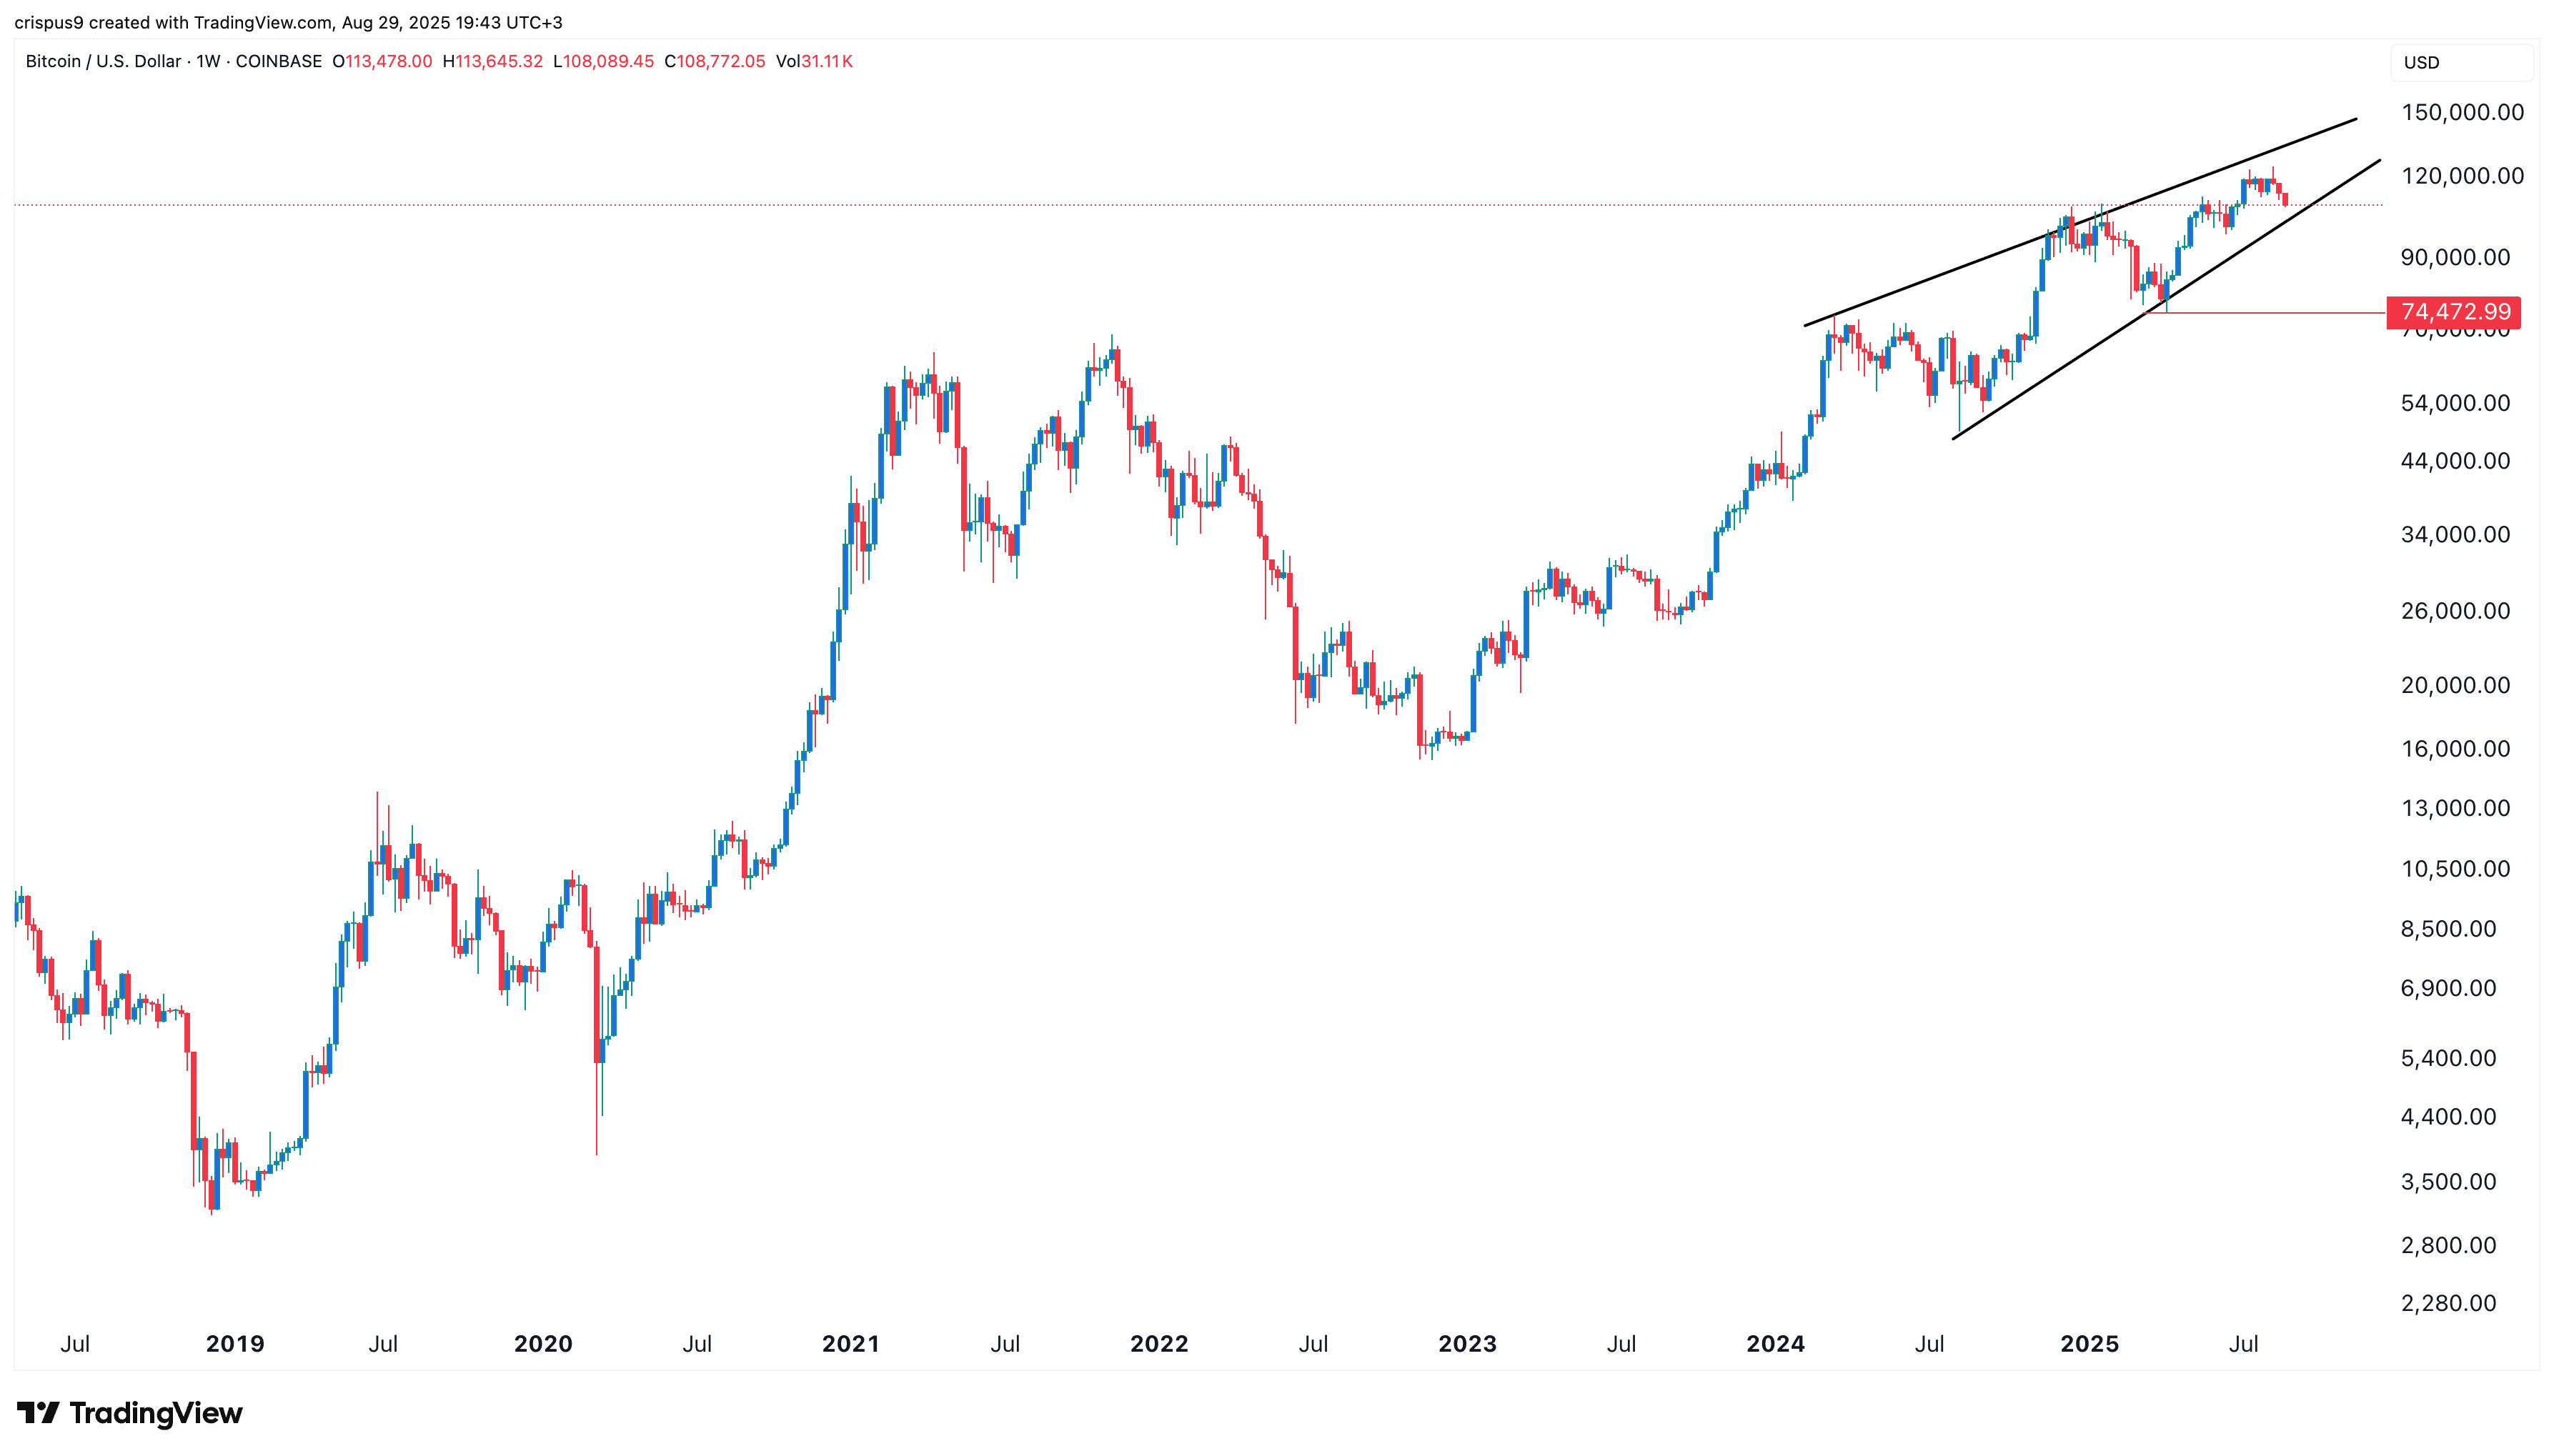
The other notable risk is that Bitcoin has been slowly forming a highly risky pattern since March last year. The weekly logarithmic chart pattern shows that it has formed an ascending wedge pattern.
Its upper line connects the higher highs since March 11 last year, while the lower line links the lowest levels since August. These lines are nearing their convergence, risking a stronger crash in the coming weeks.
The bearish BTC price forecast will be confirmed if the coin drops below the lower side of the wedge pattern at $105. If this happens, there is a risk it could plunge to the support at $74,470, its lowest level in April.
Disclosure: This article does not represent investment advice. The content and materials featured on this page are for educational purposes only.
Crypto Treasuries Chase A New Kind Of Capital
There is a peculiar irony at the heart of the crypto treasury movement. Companies that staked their futures on digital a... Read more
What Strategy's Bitcoin Sale Really Tells Us
There is a moment in every bull run when the narrative starts to fray. Not with a crash, not with a scandal, but with so... Read more
The Clock Is Ticking On UK Stablecoins
The world is not waiting for Britain to make up its mind. While the United States and the European Union have spent the ... Read more
From Cypherpunk To Citadel
How Crypto Moved from the Wild West to the Mainstream Financial SystemA long-form analysis of Bitcoin's journey from fri... Read more
Tether Plots Global Expansion
Stablecoin leader seeks to transform itself from crypto plumbing provider into a broad “freedom tech” conglomerateTe... Read more
World Liberty Seeks Federal Trust Charter
World Liberty Financial, the crypto venture backed by the Trump family, has applied for a US national bank trust charter... Read more