
US Dollar, EUR/USD, USD/CAD, USD/JPY Talking Points:
- The US Dollar has found resistance it likes around the 91.33 Fibonacci level.
- Friday brings Non-Farm Payrolls and it appears that we’re in a ‘bad is good’ type of state, where negative data may spell less pressure on the higher rates theme.
The US Dollar is continuing to hold at the same resistance that was in play yesterday, with the recent build of a bullish trendline, highlighting how this resistance has been carrying a diminishing marginal impact. That’s allowed for the build of an ascending triangle formation which will often be approached with the aim of bullish breakouts.
To learn more about the ascending triangle formation, check out DailyFX Education
At this point, the big question is whether USD bulls might get the ammunition to elicit a topside breakout, and it looked like that might be lining up yesterday when current Treasury Secretary and former FOMC Chair, Janet Yellen, opined about the possible need to hike rates in order to avoid the economy from overheating. Well, one look at markets like Lumber or Corn or Copper, or Dogecoin, and that overheating concern becomes quite obvious. But, so far the Fed and Chair Powell have remained far from that camp, leaving investors in a confounding spot of balancing between the reality of the inflation that we’re seeing with our own eyes and the claims of Central Bankers that qualify those drivers as ‘transitory.’
Friday of this week brings Non-farm Payrolls and this is where the matter may get some better definition. If we do see a really strong showing, that could elicit USD-strength on the basis that the Fed is that much closer to hiking rates. But, if data comes in below expectations, well, we may be back in one of those ‘bad is good’ themes where negative econ data spells the possibility of even more FOMC accommodation.
To learn more about Non-Farm Payrolls (NFP), check out DailyFX Education
US Dollar Hourly Price Chart

Chart prepared by James Stanley; USD, DXY on Tradingview
EUR/USD Falling Wedge at Support
Going along with that resistance item in the US Dollar is a support inflection in EUR/USD. This support zone is in a familiar spot on the chart, as the 1.1965-1.2000 area has been in-play in varying ways since last August.
This is quite the change of pace, as last week saw a very strong EUR/USD test a key zone of resistance running from 1.2134-1.2167; and the USD strength on Friday that’s so far held through this week has helped the pair to push down to that support zone.
On a shorter-term basis, there’s been a build of a falling wedge formation, which is often approached with the aim of bullish reversals.
To learn more about the falling wedge formation, check out DailyFX Education
EUR/USD Two-Hour Price Chart

Chart prepared by James Stanley; EURUSD on Tradingview
USD/CAD Breakdown Keeps Bears in Order for USD-Weakness Scenarios
The most recent Bank of Canada rate decision saw the BoC take a major step as one of the first Central Banks to announce their possible move away from pandemic policy. The Canadian Dollar caught a bid, and the continued strength in oil prices has likely played a hand in that strength, as well.
As I had shared in yesterday’s webinar, this puts USD/CAD in a fairly attractive spot for bearish USD-scenarios.
USD/CAD has continued to fall, this morning setting another fresh three-year-low, and if we do see USD-weakness on the back of Friday’s NFP report, the bearish drive in USD/CAD remains as an appealing theme.
USD/CAD Weekly Price Chart
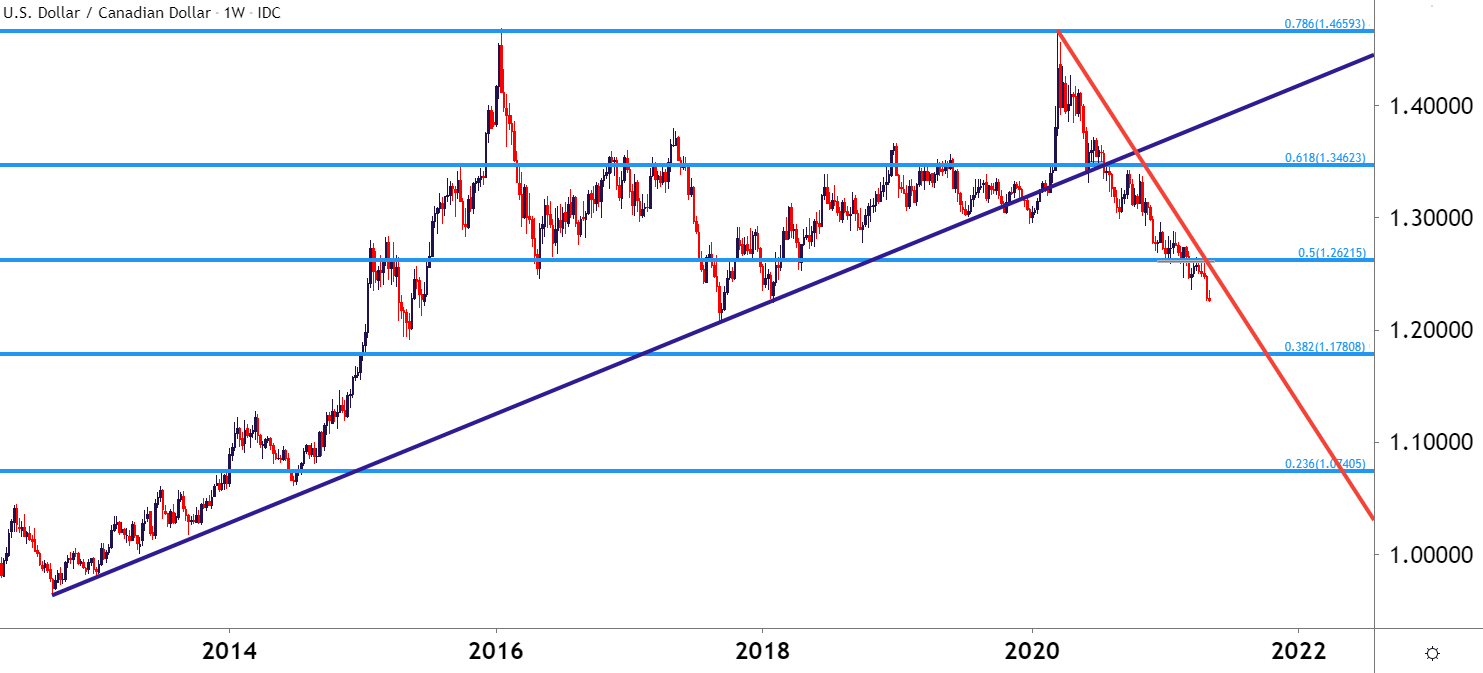
Chart prepared by James Stanley; USDCAD on Tradingview
USD/JPY Drives Deeper into Triangle
USD/JPY put in a riveting Q1, driven by the reflation trade and the prospect of higher rates in the US. With the Bank of Japan still sitting on negative rates for now the fifth year, the prospect of higher rates in the US came along with the potential for carry, and that brought upon a strong bullish trend in Q1.
But Q2 has seen the Fed continue to push back on the topic of rate hikes and this has helped stocks to ascend while the US Dollar has fallen. This impacted USD/JPY, as well.
But over the past few weeks and as USD-strength and the potential for higher rates has become a noisier issue, USD/JPY has started to tick-higher, giving the appearance that bulls may soon be on return.
USD/JPY could be compelling for USD-strength scenarios given the alignment of drivers.
USD/JPY Four-Hour Price Chart
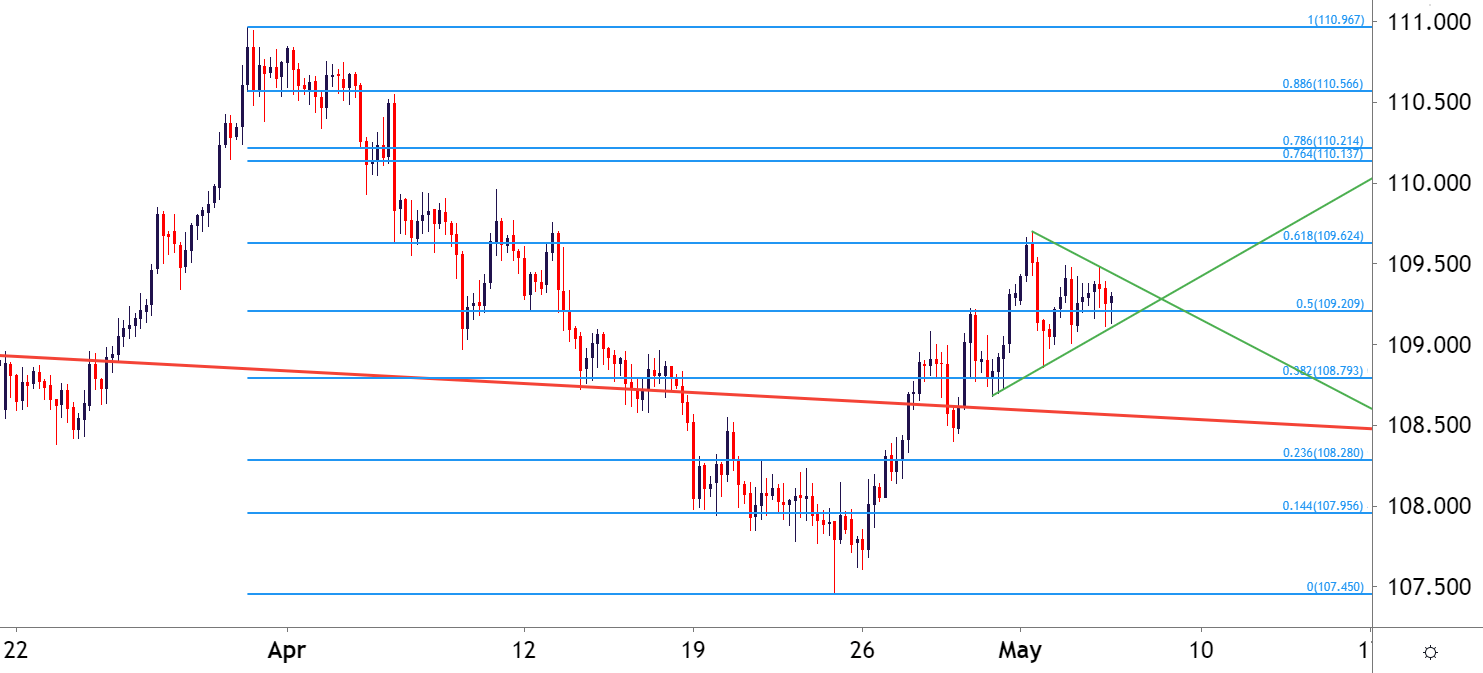
Chart prepared by James Stanley; USDJPY on Tradingview
--- Written by James Stanley, Senior Strategist for DailyFX.com
Contact and follow James on Twitter: @JStanleyFX