
US Dollar, EUR/USD, GBP/USD, AUD/USD Price Analysis
- The US Dollar gained 8.8% in a ten-day span as risk aversion enveloped global markets.
- EUR/USD broke down to a fresh two-year-low, but AUD/USD set a fresh 17-year-low and GBP/USD put in a 35-year-low.
- The US Dollar shied away from a big zone of resistance at 103.00 on DXY last week, and has since put in a 23.6% pullback. But – is the bullish trend yet over? Or is the USD just reloading for a run towards 19-year-highs?
US Dollar Shows Extreme Volatility as Risk Aversion Envelops Global Markets
We’re now in the stretch run for the end of March and it’s been a brutal month across global markets. While stocks have been hammered the world-around, there’s been some massive moves under the surface as well, with Treasuries going on a wild ride and the chart of ‘TLT,’ representing US debt with 20+ years of maturity, taking on a tone more like a cryptocurrency rather than that of the stalwart in sovereign debt that it’s always been.
This entrance of extreme volatility has shown through currency markets, as well, with the US Dollar catching an aggressive bid a couple of weeks ago that pushed DXY from a fresh yearly low up to a brand new three-year-high. This type of move or reversal would normally take months: But in this case, it took about ten days, two of which when markets were closed for the weekend. Last Thursday saw the Greenback climb-up to that fresh three-year-high and since then a pullback has started to show, with buyers stopping just short of the 103.00 figure that turned around the advance in early-2017.
So far, that pullback has been restrained by the 23.6% Fibonacci retracement of the recent bullish move.
US Dollar Daily Price Chart

Chart prepared by James Stanley; USD on Tradingview
The US Dollar is holding resistance at a confluent area on the chart, as both the 14.4% retracement of the recent breakout move syncs with the 38.2% retracement of a much longer-term move, taking the high from the year of 2011 and drawn down to the low of the Financial Collapse in March of 2008. Also of note on the resistance side and a price that hasn’t yet come into play is the 103.00 area on DXY, and the current three-year-high at 102.99 shows that buyers had previously shied away from a re-test of this key zone. That area around the 103 level is what helped to turn around a bullish advance after the US Presidential election in 2016; with December of 2016 and January of 2017 showing four consecutive weeks of resistance before sellers finally able to take-control.
US Dollar Monthly Price Chart
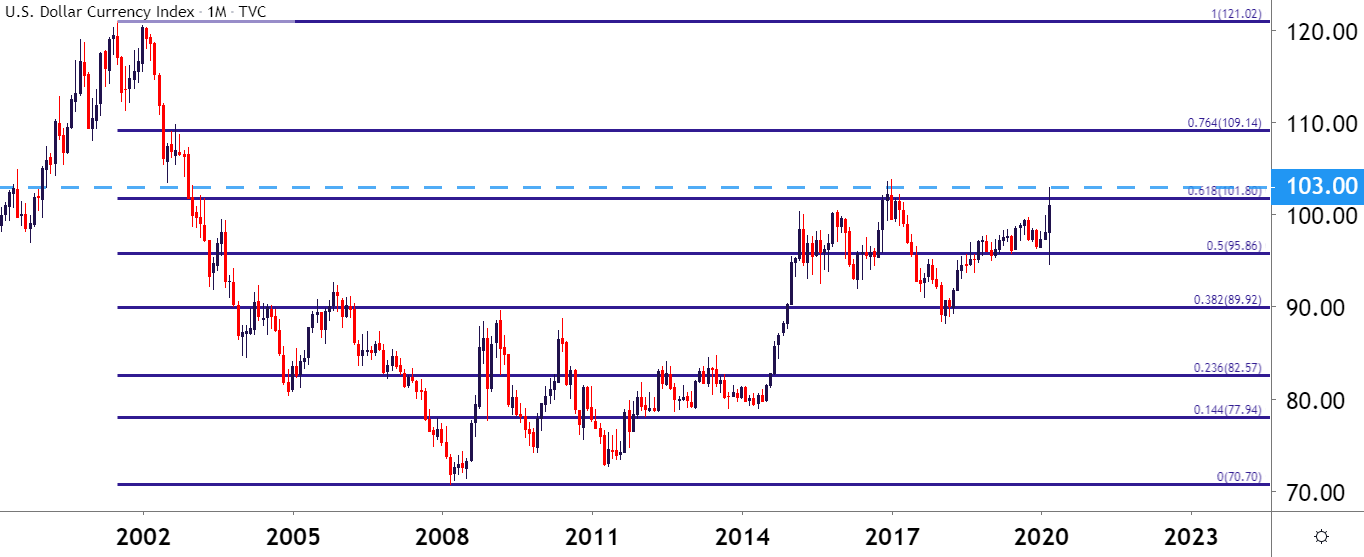
Chart prepared by James Stanley; USD on Tradingview
EUR/USD Finds Support at Two-Year-Lows
EUR/USD visibly showed that bullish run in the US Dollar, with EUR/USD dropping aggressively from a resistance test in the 1.1500 area down to fresh two-year-lows last Thursday/Friday. Sellers even pushed down to another technical two-year-low on Monday of this week, but as a bit of pressure has been released from the massive bullish run in the US Dollar, EUR/USD has pulled back to the 1.0750 psychological level. As looked at in yesterday’s webinar, this pullback appears to be taking the form of a bear flag formation, which will often be approached with the aim of short-side continuation. Timing, of course, remains a concern and given the aggressiveness of the sell-off, the corresponding pullback may continue to run with the bearish posture remaining intact.
EUR/USD Two-Hour Price Chart
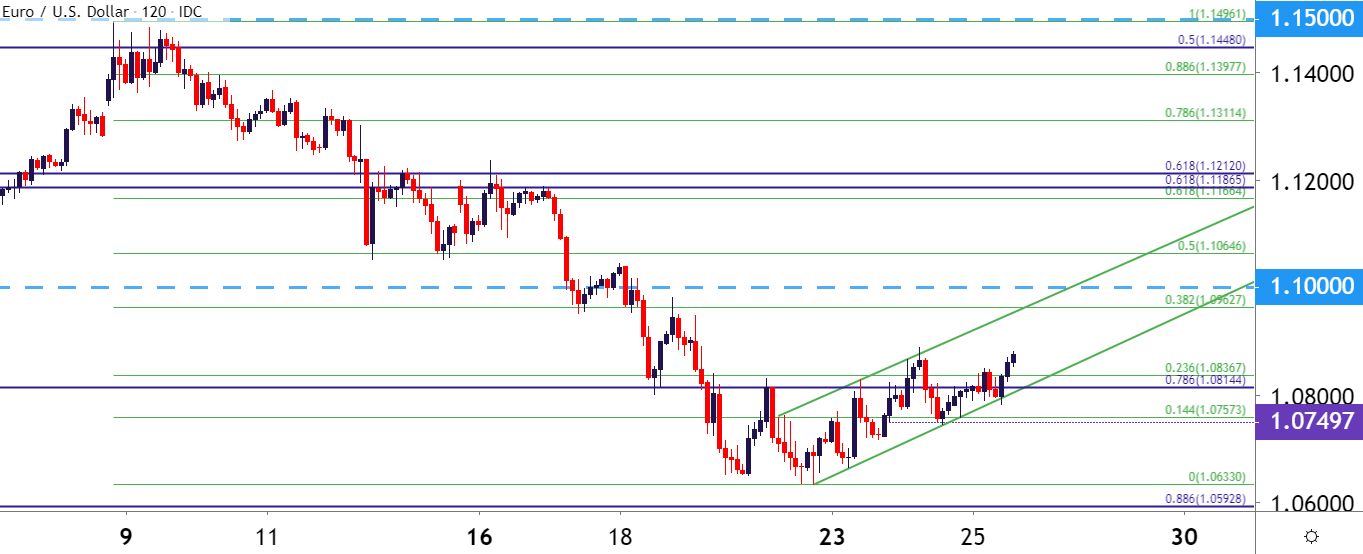
Chart prepared by James Stanley; EUR/USD on Tradingview
Taking a step back to put the pullback into relative scope, and the 38.2% retracement of the recent sell-off is close to the 1.1000 psychological level, which was previously a big zone of support in the pair. That support zone came into play in October of last year and helped to hold the lows through the New Year open. Sellers finally took it out in early-February but, to date, it hasn’t shown much for follow-through resistance. The confluence of this 38-pip area on the chart can remain as attractive for resistance scenarios in the pair.
EUR/USD Four-Hour Price Chart

Chart prepared by James Stanley; EUR/USD on Tradingview
GBP/USD: Cable Collapse to 35-Year Lows
Coronavirus is compelling a lockdown in the UK, as well, and the British Pound has been hit over the past couple of weeks as risk aversion has driven flows into the US Dollar. In GBP/USD, the pair encroached upon a key zone of support last week; coming in at a similar area that held last summer’s sell-off around the 1.2000 handle.
But – when this zone came back into play last week, it was support no more as sellers crushed GBP/USD price action down to a fresh 35-year-low. Prices tested below the 1.1500 level for a bit but sellers had difficulty establishing any momentum underneath the psychological level; and since then price action has peeled back by as much as 500 pips with a bit of resistance showing from that prior zone of key support, taken from the 1.1950-1.2000 area on the chart.
This can keep the pair as a compelling scenario for those looking at long-USD strategies.
GBP/USD Weekly Price Chart
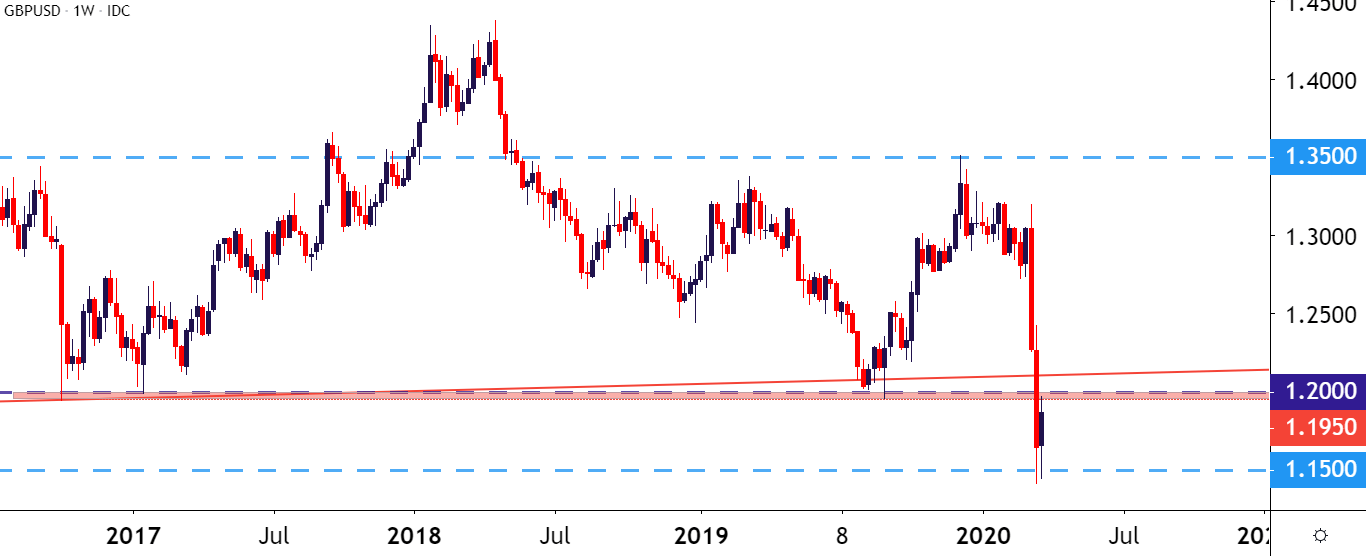
Chart prepared by James Stanley; GBP/USD on Tradingview
AUD/USD: Aussie Spills to 17-Year Lows, Finds Mercy Bounce Back to Big Fig
A similar sell-off showed in AUD/USD as the pair rushed down to a fresh 17-year-low last week, taking out the .6000 spot that had previously helped to bring in support during the depth of the Financial Collapse. Sellers slowed the push just above the .5500 level, marking for an outsized run in a pair that came into the year holding around the .7000-handle.
But as worries transferred from China to Western markets, the Aussie went along for the ride as what initially showed as a pain point for China has now spread globally, creating a swell of risk aversion that resembles the sell-off from 2008. At this point, price action has held above the 88.6% retracement of the 2001-2011 major move; and that bounce has so far extended back-up to the .6000 big figure.
AUD/USD Monthly Price Chart
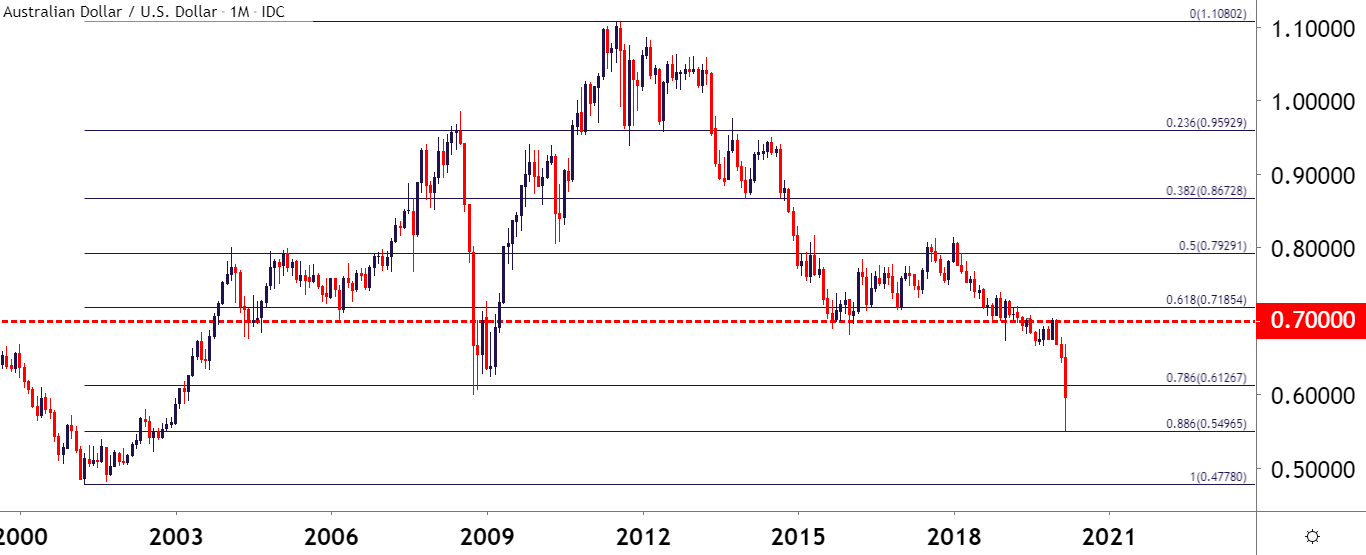
Chart prepared by James Stanley; AUD/USD on Tradingview
On a shorter-term basis, that resistance at .6000 has set-in over the past couple of days. But, unlike the pullback looked at in EUR/USD above – the near-term move in AUD/USD has taken on the shape of a rising wedge pattern. Given that the wedge is forming after an aggressively bearish move, it can be approached with a similar aim of bearish continuation but – given the fact that buyers are showing more hesitation at highs or around resistance, especially with a key level in play such as the .6000 handle, this may be construed in an even more bearish fashion.
AUD/USD Four-Hour Price Chart
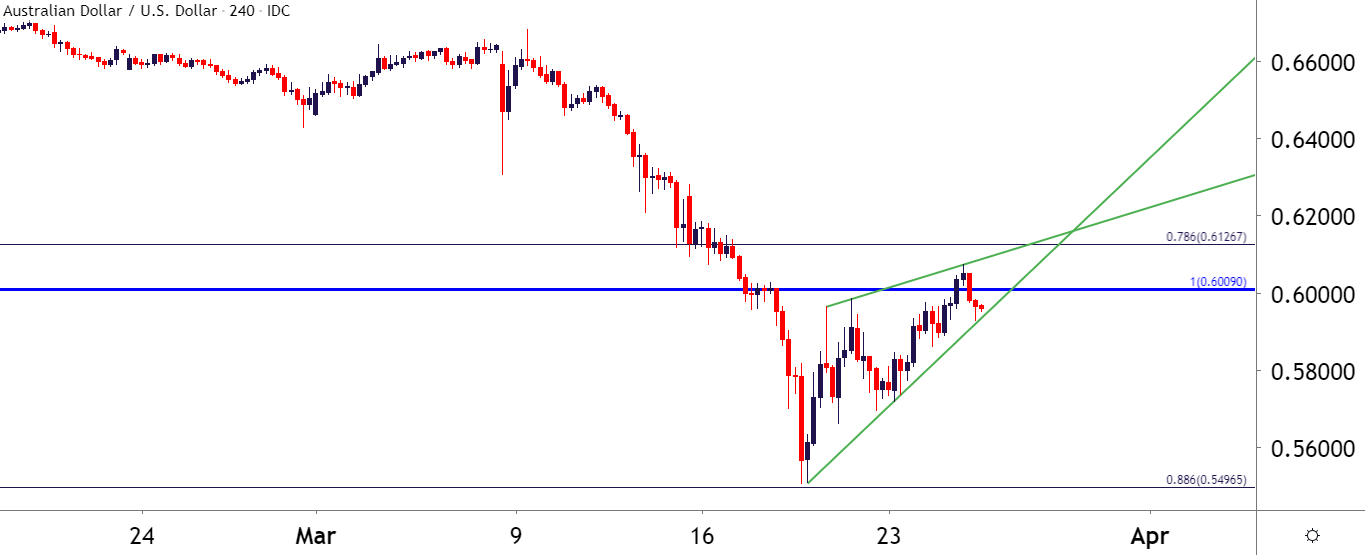
Chart prepared by James Stanley; AUD/USD on Tradingview
US Dollar Strategy
It’s always difficult to build strategy parameters after a huge breakout catapults prices up to fresh multi-year-highs; and when that takes place in the US Dollar, it can be extra difficult as that move is likely showing visibly across a swath of currency pairs. It can be especially difficult to plot for short-USD scenarios given the veracity of the move, and in those cases it can be a situation of choosing the ‘least bad’ setup as opposed to the most attractive one.
From the above three scenarios, this may point out potential for USD-weakness in EUR/USD, looking for prices to make a move back towards the 1.1000 handle before finding that next area of lower-high resistance. Both GBP/USD and AUD/USD are testing key resistance areas on the chart already, which can keep the door open for bearish continuation scenarios in each.
--- Written by James Stanley, Strategist for DailyFX.com
Contact and follow James on Twitter: @JStanleyFX