

US Dollar, EUR/USD, GBP/USD, AUD/USD Price Analysis:
- It’s been an eventful week across global markets and the US Dollar is back to the same zone of support that held the lows in June and then earlier this week.
- EUR/USD has flickered up to its own key area, with resistance holding from around 1.1446-1.1500 following this morning’s ECB rate decision.
- GBP/USD has been mired in a range and AUD/USD is testing a key area of resistance around the .7000 big figure that bulls haven’t been able to leave behind after more than month worth of tests.
US Dollar Reverts to Support
The US Dollar has moved back to a key zone of support following last week’s test in the same area. This is the same zone of prices that helped to set the three-month-low in June, spanning from 95.86-96.05 on the DXY chart.
Given the increasing frequency of tests with the lower-highs that have continued to post, and the USD may be carrying breakout potential as we move deeper into Q3 trade. Bears are continuing to press the matter but, as yet, price action hasn’t been able to test below that June swing low. On the below two-hour chart, the lower-highs that have been posting since the Q3 open are highlighted by two red trendlines. The support zone in question, highlighted in blue, is now facing its third test since the June open.
US Dollar Two-Hour Price Chart

Chart prepared by James Stanley; USD, DXY on Tradingview
US Dollar Bigger Picture
Taking a step back on the chart and we can see how this same zone has been in-play on the US Dollar for the past couple of years. Notably, this area of prices helped to set the low in DXY on multiple occasions in 2019, including February, March and then again in June. It came back into the equation this March, as the coronavirus was getting priced-in; and while price action did test below this area, that theme was brief, and bulls quickly pushed prices back above this key spot on the chart.
The big question: As coronavirus new cases swell and as expectations for a continued dovish outlook from the FOMC permeate the backdrop – will USD bears be able to finally push below this area on the chart for a lasting move? The answer to that will likely be at least partly associated with whether or not bulls can grab ahold of the Euro, and we’ll investigate that in our next set of charts.
US Dollar Weekly Price Chart

Chart prepared by James Stanley; USD, DXY on Tradingview
EUR/USD Returns to Resistance, EU Summit Looms Large
This morning’s ECB rate decision brought little by the way of new information; but EUR/USD did show a quick move back up to a key spot of resistance. Perhaps the more interesting item on the horizon is the EU Summit, where there is certainly the opportunity for some new information to filter into markets. This may, however, present some gap risk as that Summit spans into the weekend after many markets have already closed down.
The big spot of emphasis on the pair is the 1.1446-1.1500 zone which, similar to the 95.86-96.05 zone on DXY above, has been in play for more than a year. The notable exception being that this zone hasn’t been violated in over a year; and the March outlay of volatility saw price action remain inside of the 1.1500 handle.
Will EUR/USD bulls bid the pair after next week’s open on the results of the EU summit? Or will this key zone hold yet another inflection before prices reverse and remain in the realm of mean-reversion?
EUR/USD Weekly Price Chart

Chart prepared by James Stanley; EUR/USD on Tradingview
GBP/USD Builds Shorter-Term Range
While the British Pound enjoyed a boisterous start to Q3, the past week has been a bit more muted as prices have fallen back into a pattern of mean reversion. The upshot of that is that this short-term range has built within the confines of previously-established support and resistance zones, thereby keeping the door open for possible range strategies.
On the support side, the zone that runs from 1.2500-1.2518 has caught two separate support tests already this week; and the 1.2644-1.2689 zone has caught a couple of different resistance inflections, as well. Also coming in as an assist for support is a bullish trendline, drawn from the June 30th swing low, connecting to the Tuesday low; the projection of which ahs come into help set this morning’s low.
For those that want to look for USD strength – or a hold of USD in that key zone of support plotted above, range strategies in GBP/USD may remain as attractive. But, for those that are looking for a bearish break in USD, re-assigning that resistance to potential breakout logic on the long side may be the more operable way of moving forward.
GBP/USD Hourly Price Chart
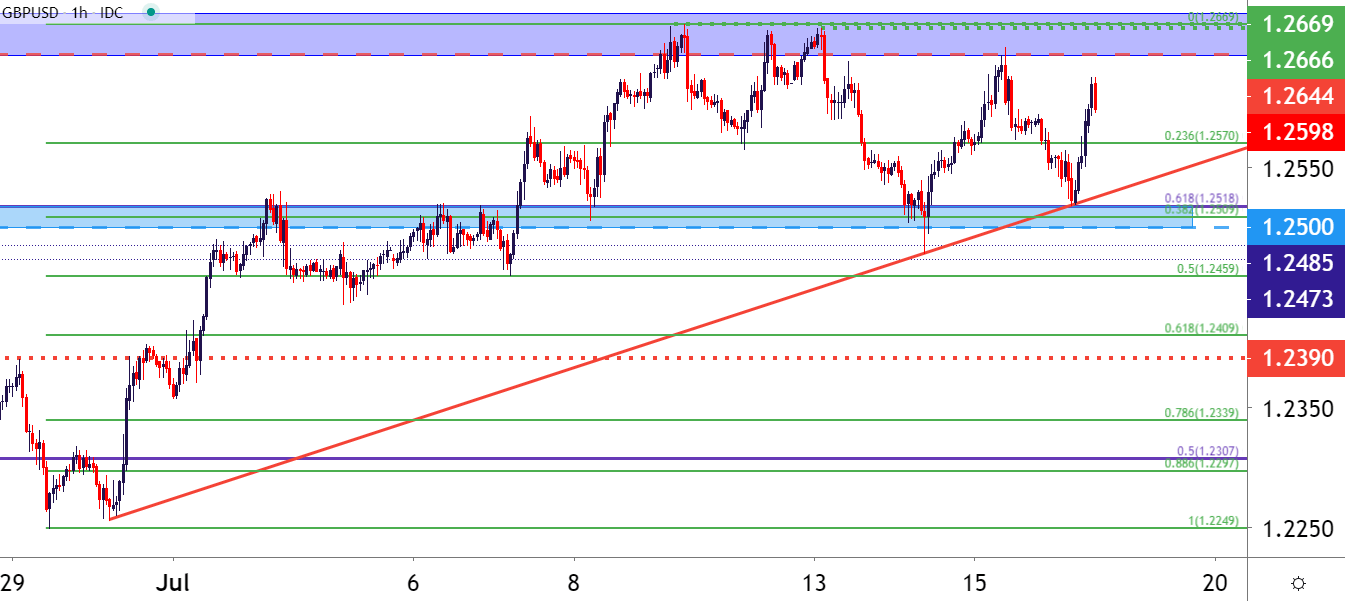
Chart prepared by James Stanley; GBP/USD on Tradingview
AUD/USD: Aussie Back Above the Big Fig – Can Bulls Drive?
It was a peculiar first half of the year for AUD/USD, and really this was the tale of two trends. The year started with pain as AUD/USD crashed down to a fresh 17-year-low. But buyers showed up before AUD/USD could take out the .5500 level; and that hard bearish trend quickly turned into an aggressive bullish trend. By mid-June prices were already back-up to a fresh high and testing above the .7000 level, but that’s about the time that price action began to shift again.
Since that initial re-test of the .7000 handle more than a month ago, the pair has attempted to re-ascend above that spot on the chart multiple times. And each has failed so far, begging the question as to whether the pair can continue in its bullish trend without more of a pullback.
This can set a fairly interesting stage around the US Dollar: For those that do want to look for support to hold in USD, reversal scenarios in AUD/USD can remain attractive under the assumption that the .7000 level may continue to hold bulls at bay. Alternatively, for USD bears, bullish breakout potential could continue to be followed in AUD/USD, looking for that eventual breach of the .7000 level in which bulls maintain control up to fresh highs.
AUD/USD Four-Hour Price Chart

Chart prepared by James Stanley; AUD/USD on Tradingview
--- Written by James Stanley, Strategist for DailyFX.com
Contact and follow James on Twitter: @JStanleyFX