

US Dollar Index, US Presidential Election, EUR/USD, AUD/USD, USD/CAD – Talking Points:
- The US Dollar Index could continue to lose ground as presidential election vote counting gets underway.
- 100-DMA nurturing EUR/USD’s rebound higher.
- AUD/USD rates eyeing a push to test yearly highs.
- USD/CAD at risk of further losses as key support comes under pressure.
The US Dollar could extend losses against its major counterparts as US presidential election vote counting gets underway. Here are the key levels to watch for the US Dollar Index (DXY), EUR/USD, AUD/USD and USD/CAD rates.
US Dollar Index Daily Chart – Break Out or False Break?
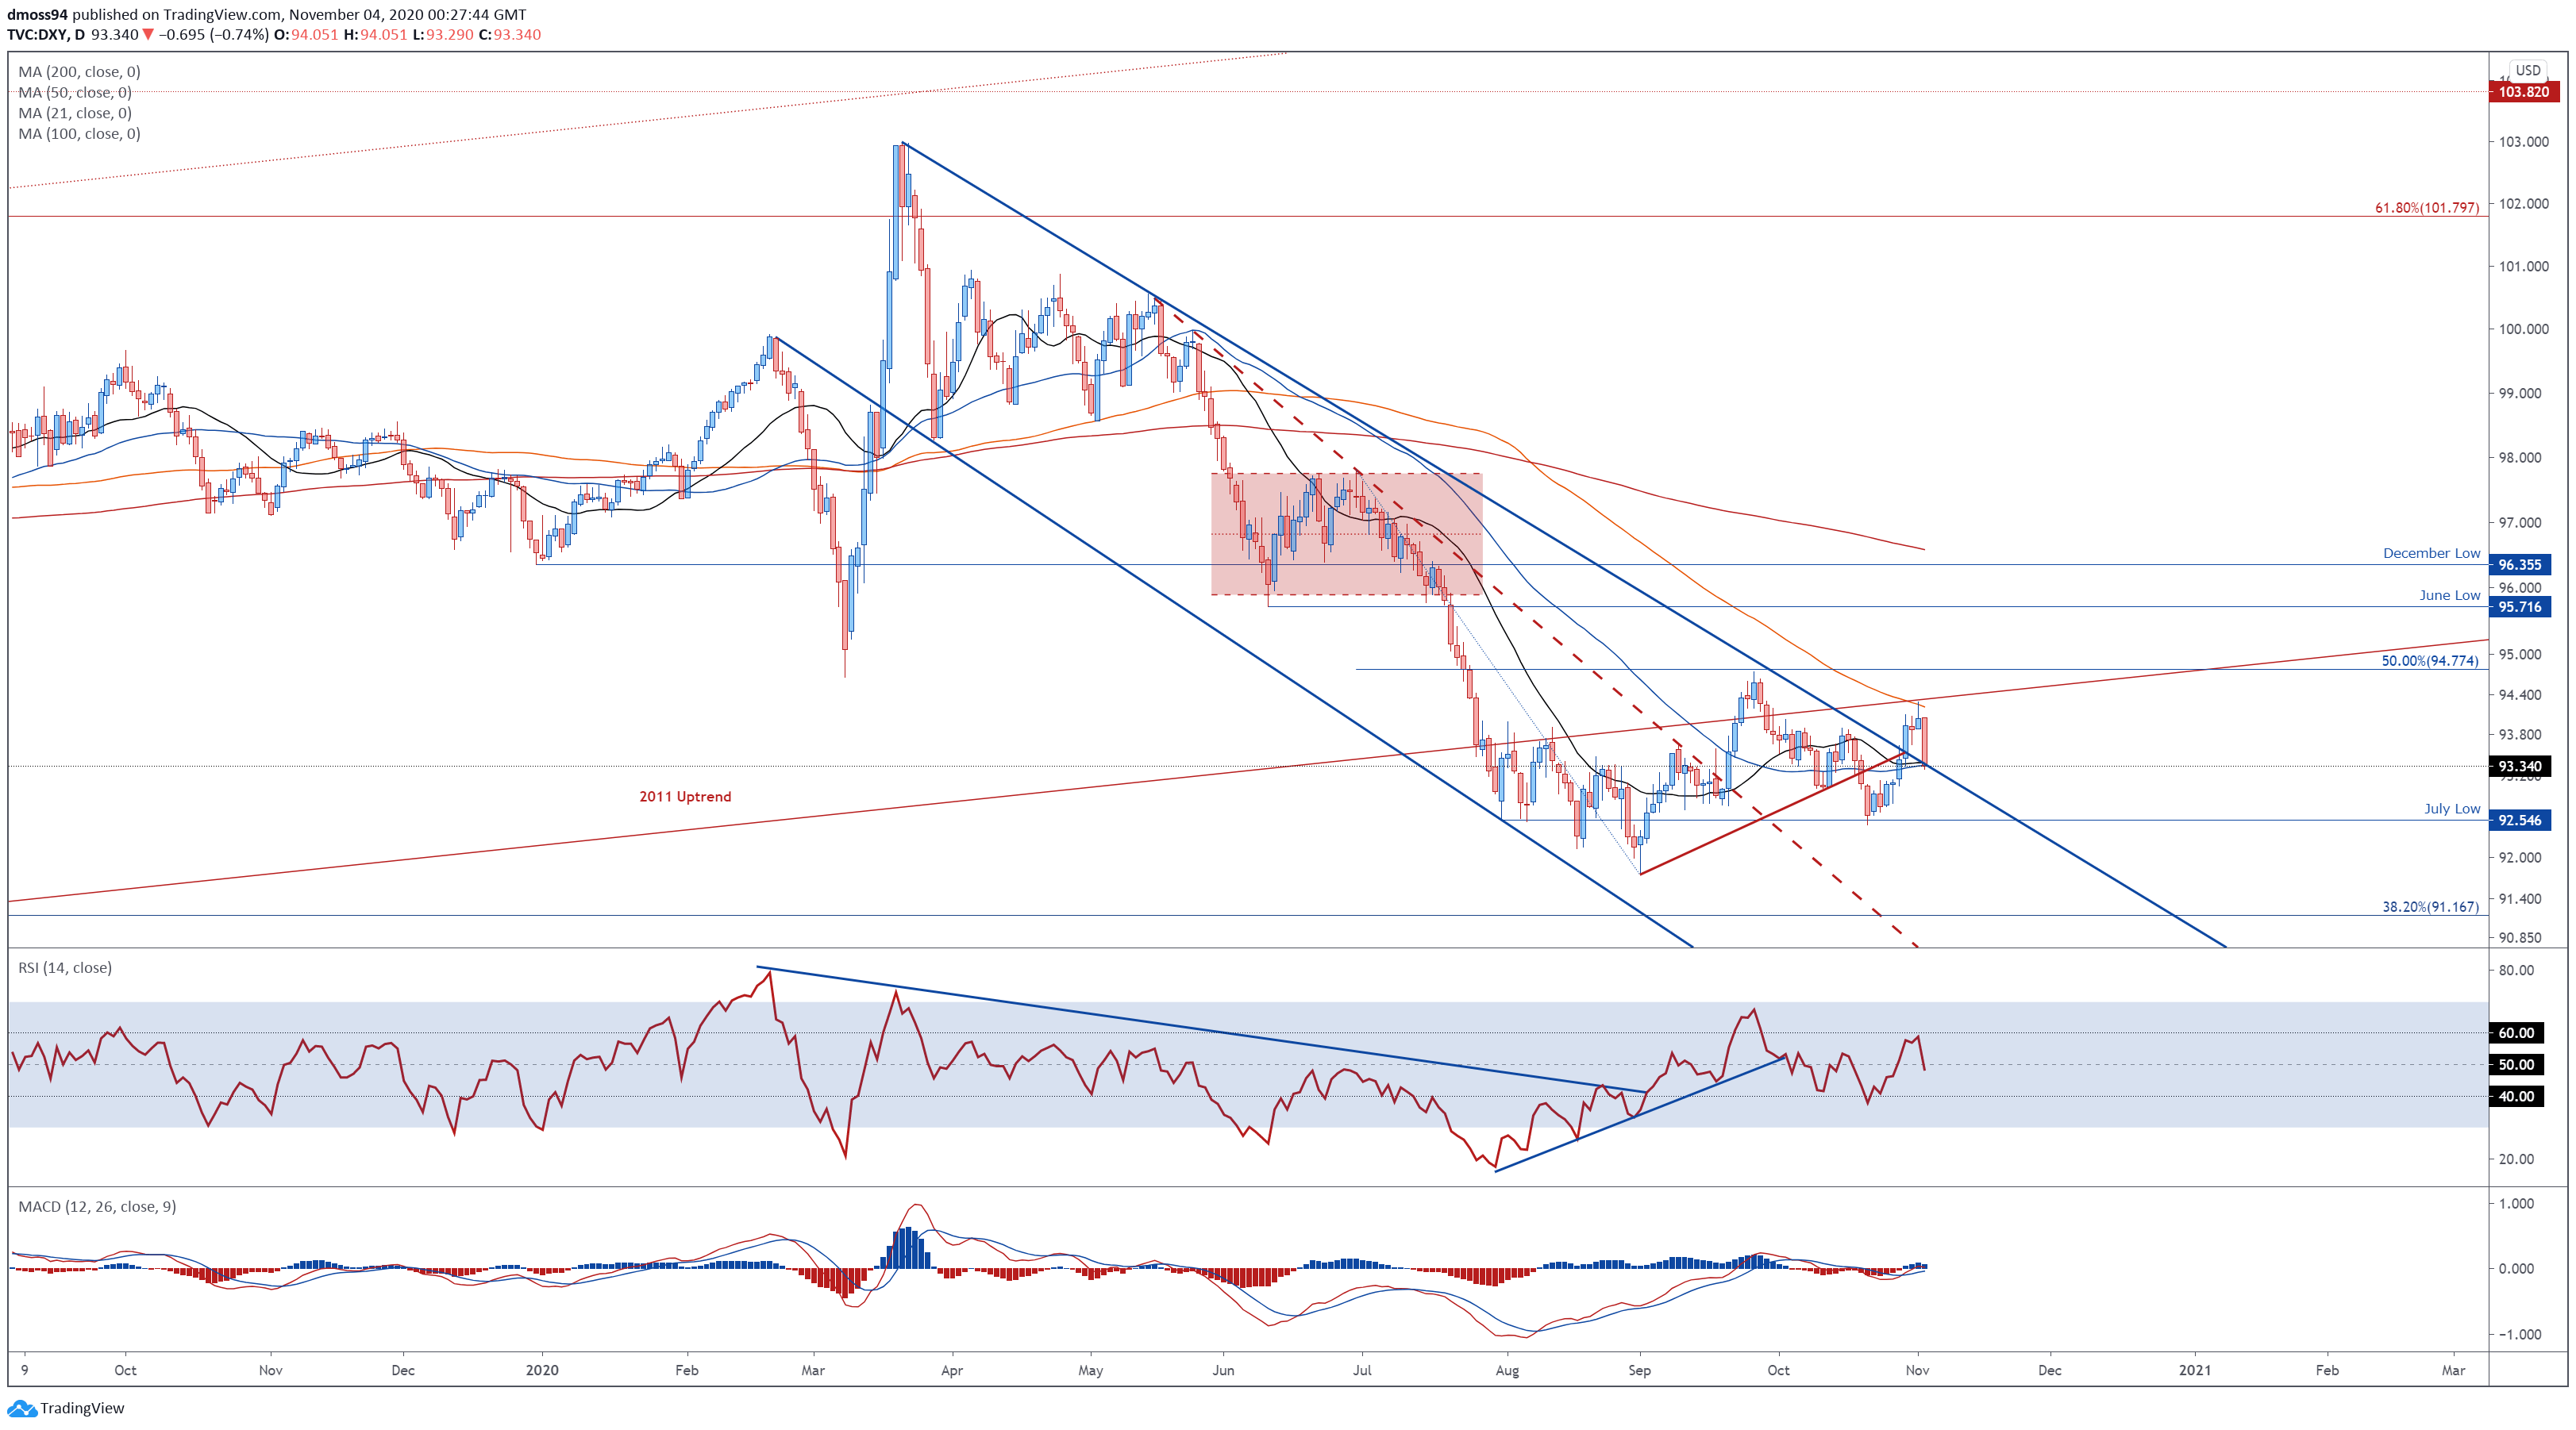
DXY daily chart created using TradingView
The US Dollar Index (DXY) could be poised to extend its retreat from the monthly high (94.28), as price fails to break above confluent resistance at the 100-DMA and 94.00 mark.
With the RSI sliding back below its neutral midpoint and the MACD indicator eyeing a bearish crossover, the path of least resistance seems skewed to the downside.
However, the recent pullback may validate the topside break of Descending Channel resistance and open the door for a retest of the November 2 high (94.28), if support at the trend-defining 50-day moving average (93.35) holds firm.
Nevertheless, further declines appear the more likely scenario given the DXY is continuing to track firmly below the 100-DMA (94.22) and 200-DMA (96.58).
A daily close back below psychological support a 93.00 would probably trigger a push to test the yearly low set on September 1 (91.75).
EUR/USD Daily Chart – 100-DMA Nurturing Rebound
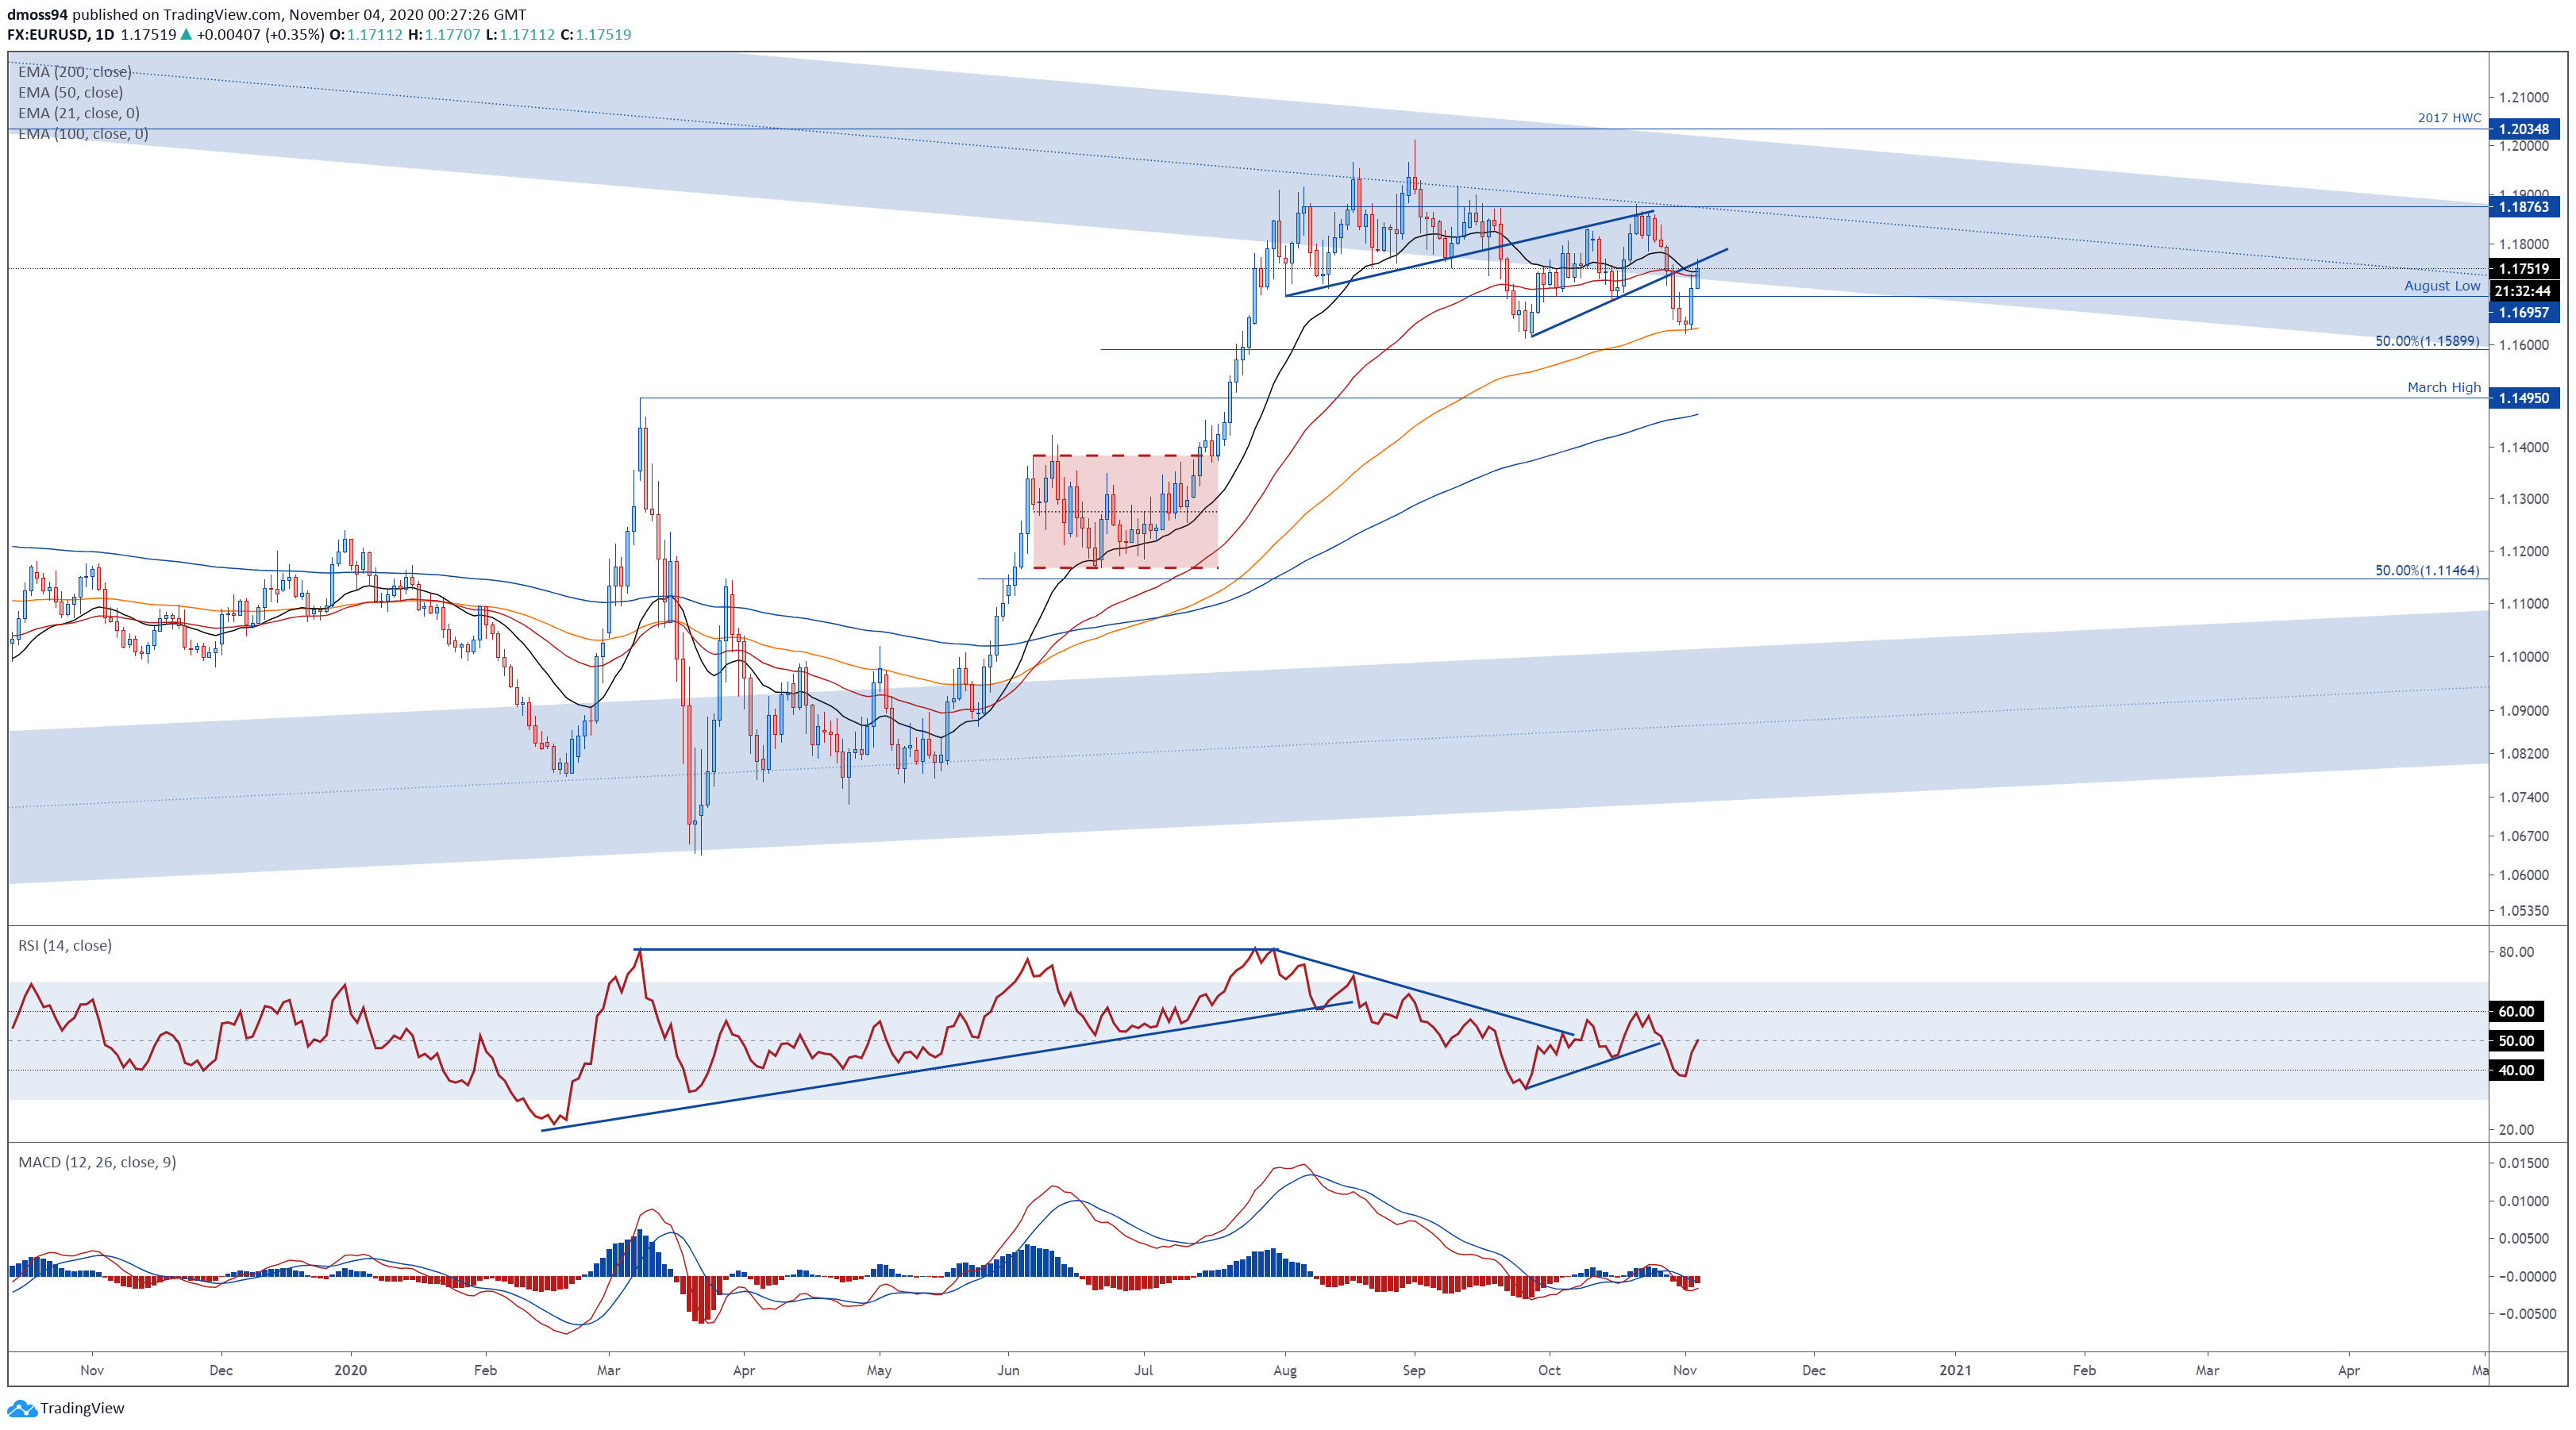
EUR/USD daily chart created using TradingView
The EUR/USD exchange rate is eyeing a push to test the October high (1.1881), as price surges away from support at the 100-DMA (1.1633) and pierces through resistance at the August low (1.1696).
With the RSI clambering back above 50 and the MACD gearing up to cross above its ‘slower’ signal line counterpart, the path of least resistance looks to be higher.
With that in mind, a daily close back above the psychologically imposing 1.1800 mark would probably encourage would-be buyers and generate a topside push towards the yearly high (1,2011).
On the contrary, failure to hold above the 21-DMA (1.1746) and 50-DMA (1.1738) could ignite a more extensive pullback and bring the monthly low (1.1622) into focus.
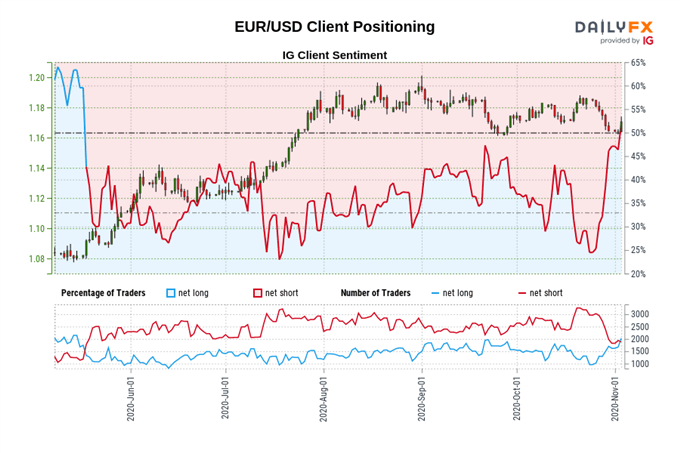
Retail trader data shows 44.64% of traders are net-long with the ratio of traders short to long at 1.24 to 1. The number of traders net-long is 22.56% lower than yesterday and 21.93% higher from last week, while the number of traders net-short is 0.05% lower than yesterday and 35.68% lower from last week.
We typically take a contrarian view to crowd sentiment, and the fact traders are net-short suggests EUR/USD prices may continue to rise.
Positioning is more net-short than yesterday but less net-short from last week. The combination of current sentiment and recent changes gives us a further mixed EUR/USD trading bias.
AUD/USD Daily Chart – Push to Yearly High on the Cards
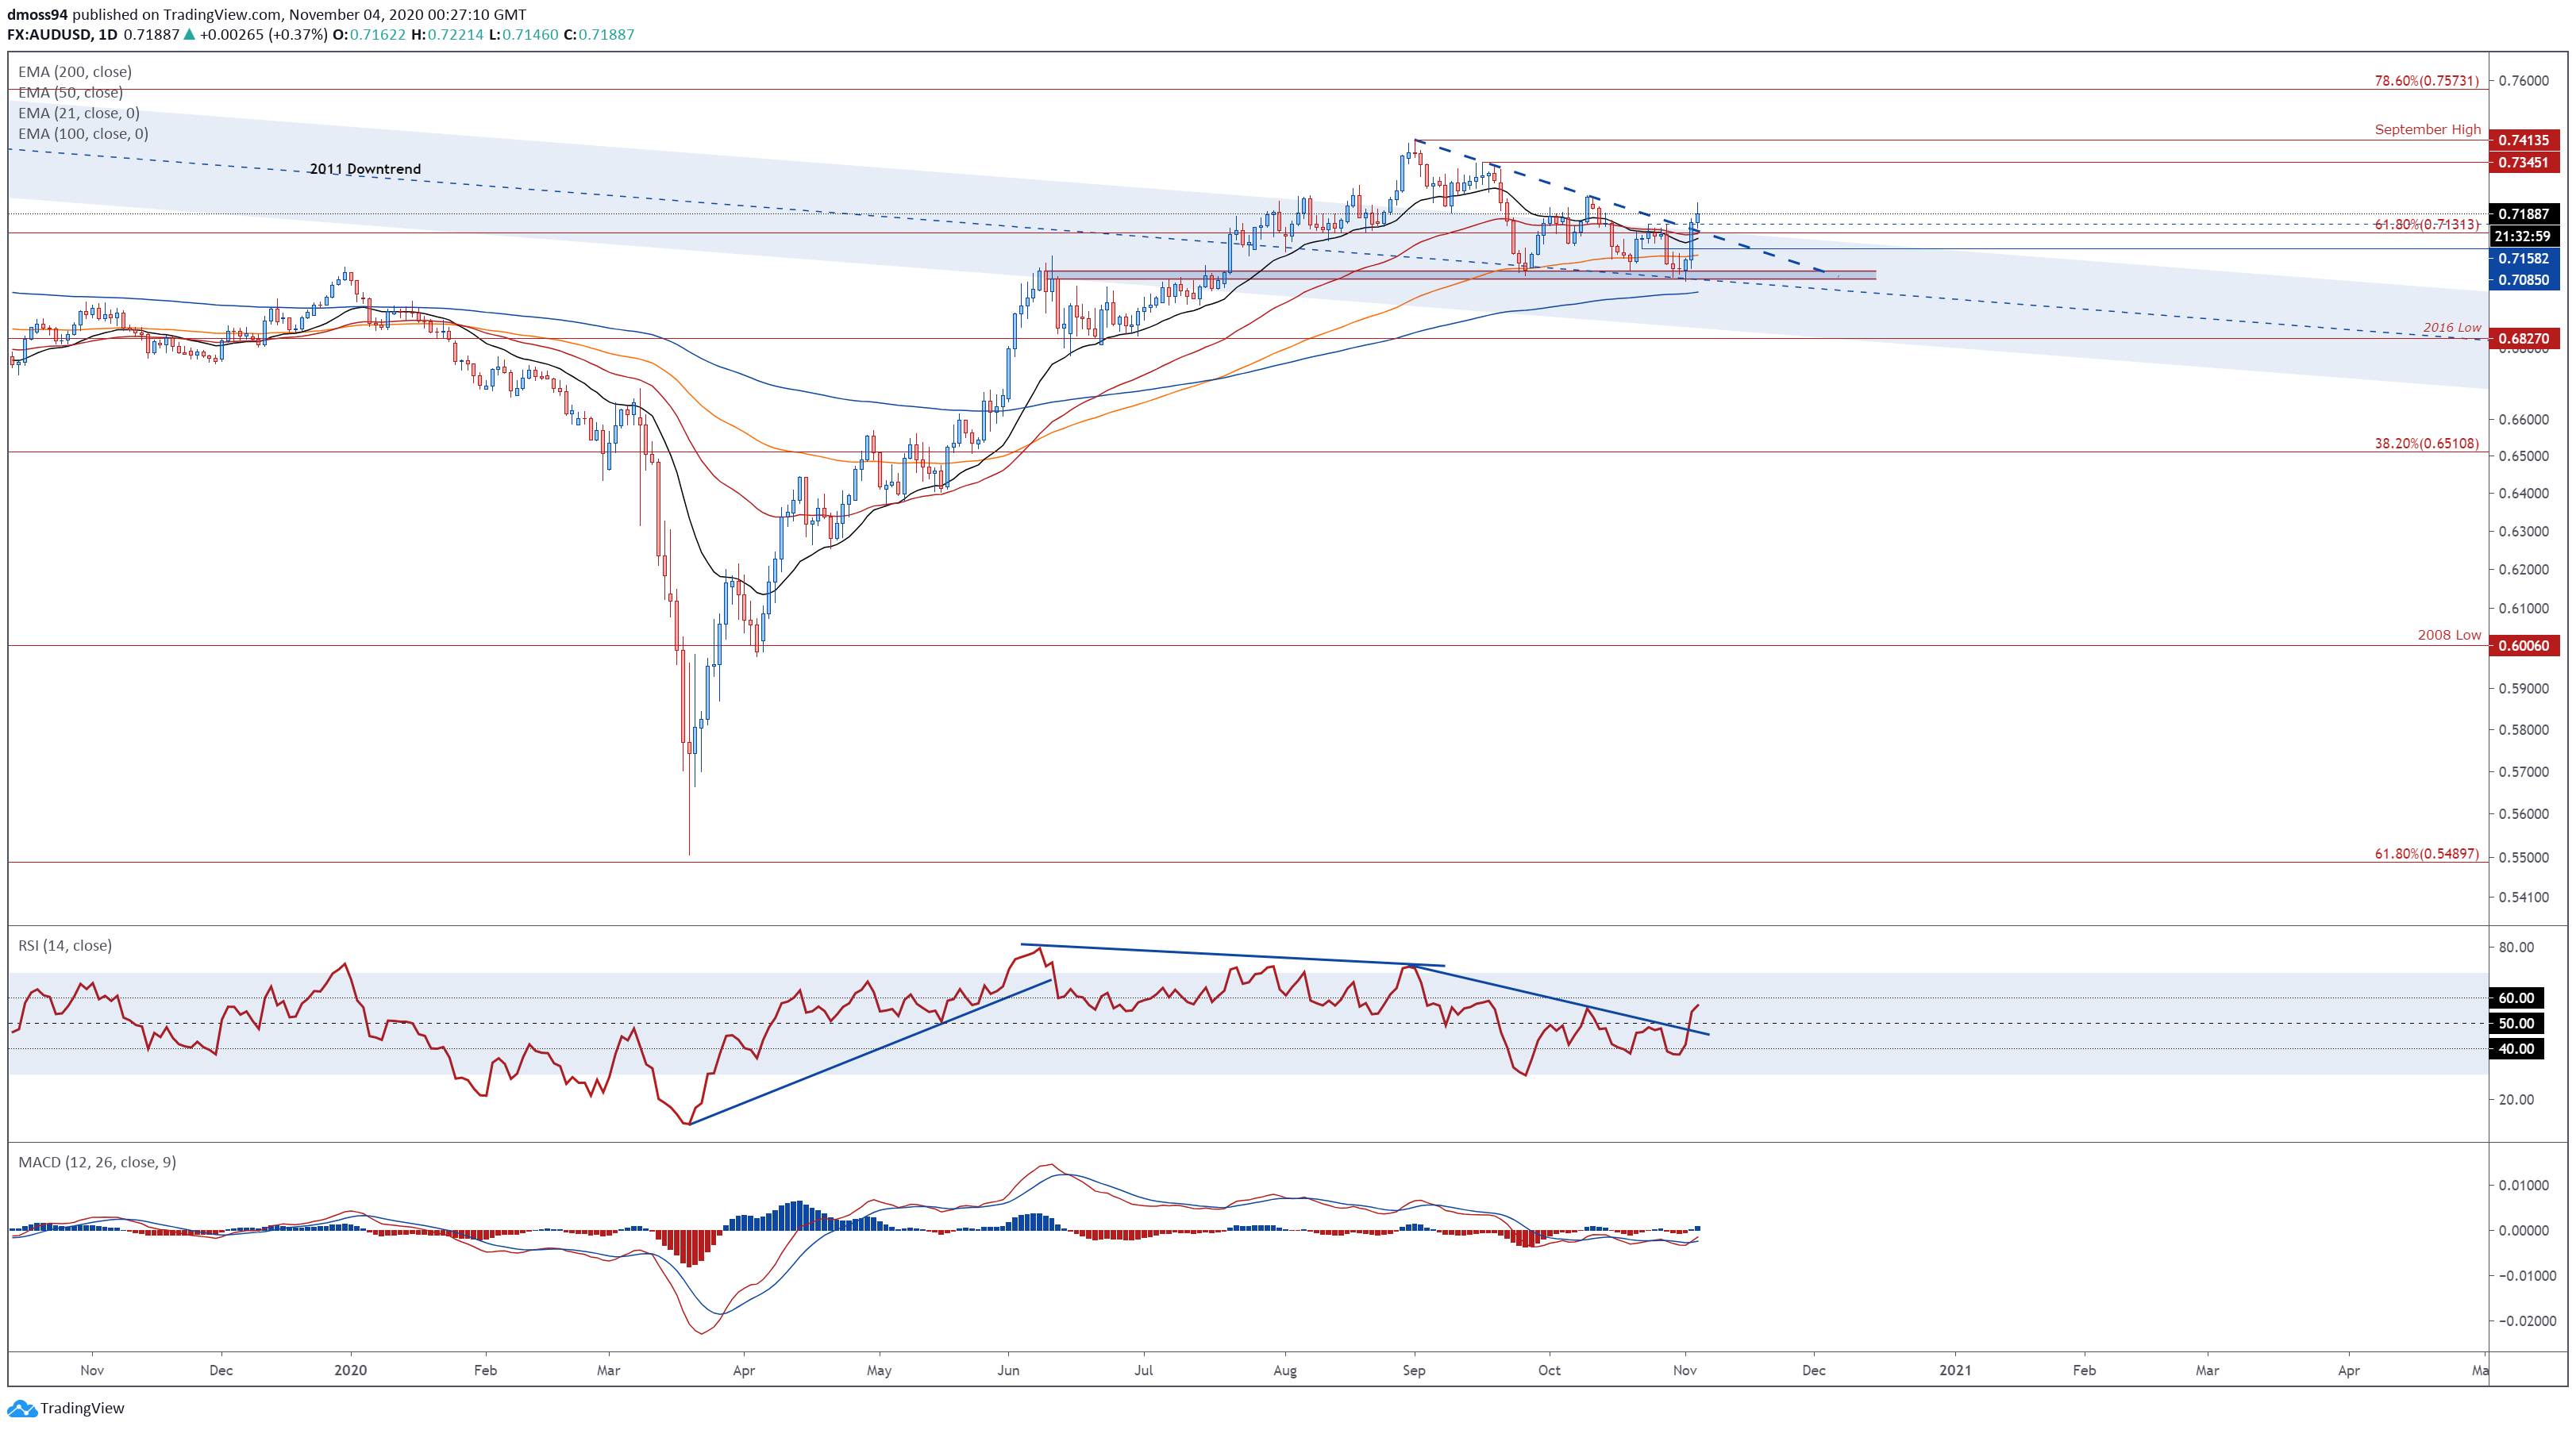
AUD/USD daily chart created using TradingView
As noted in previous reports, AUD/USD rates could be poised to push back towards the yearly high (0.7413), as price surges above Descending Triangle resistance and the RSI snaps the downtrend extending from the September extremes.
Moreover, with a bullish crossover taking place on the MACD indicator and price tracking firmly above all four moving averages, further gains appear to be on the cards if AUD/USD remains constructively perched above key support at the 61.8% Fibonacci (0.7131).
A daily close above the 0.7200 mark would probably signal a resumption of the primary uptrend extending from the March nadir and bring key resistance levels at the September 16 swing-high (0.7345) and 2020 high (0.7413).
Conversely, a break back below the psychologically pivotal 0.7100 mark could open the door to a retest of support at the monthly low (0.6991).
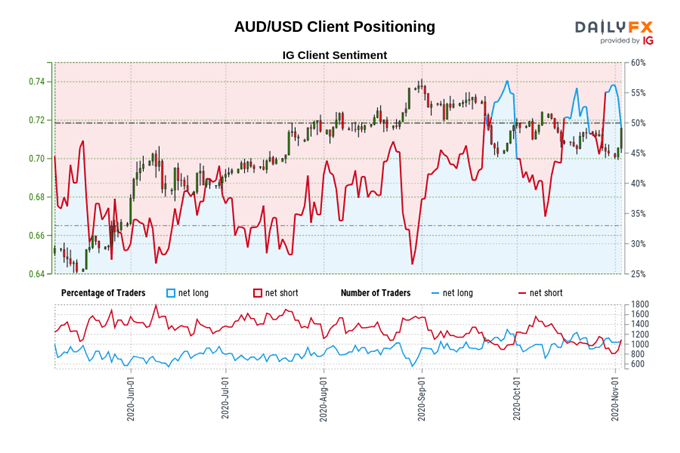
Retail trader data shows 39.40% of traders are net-long with the ratio of traders short to long at 1.54 to 1. The number of traders net-long is 28.42% lower than yesterday and 22.05% lower from last week, while the number of traders net-short is 9.35% higher than yesterday and 4.77% lower from last week.
We typically take a contrarian view to crowd sentiment, and the fact traders are net-short suggests AUD/USD prices may continue to rise.
Traders are further net-short than yesterday and last week, and the combination of current sentiment and recent changes gives us a stronger AUD/USD-bullish contrarian trading bias.
USD/CAD Daily Chart – Testing Key Support
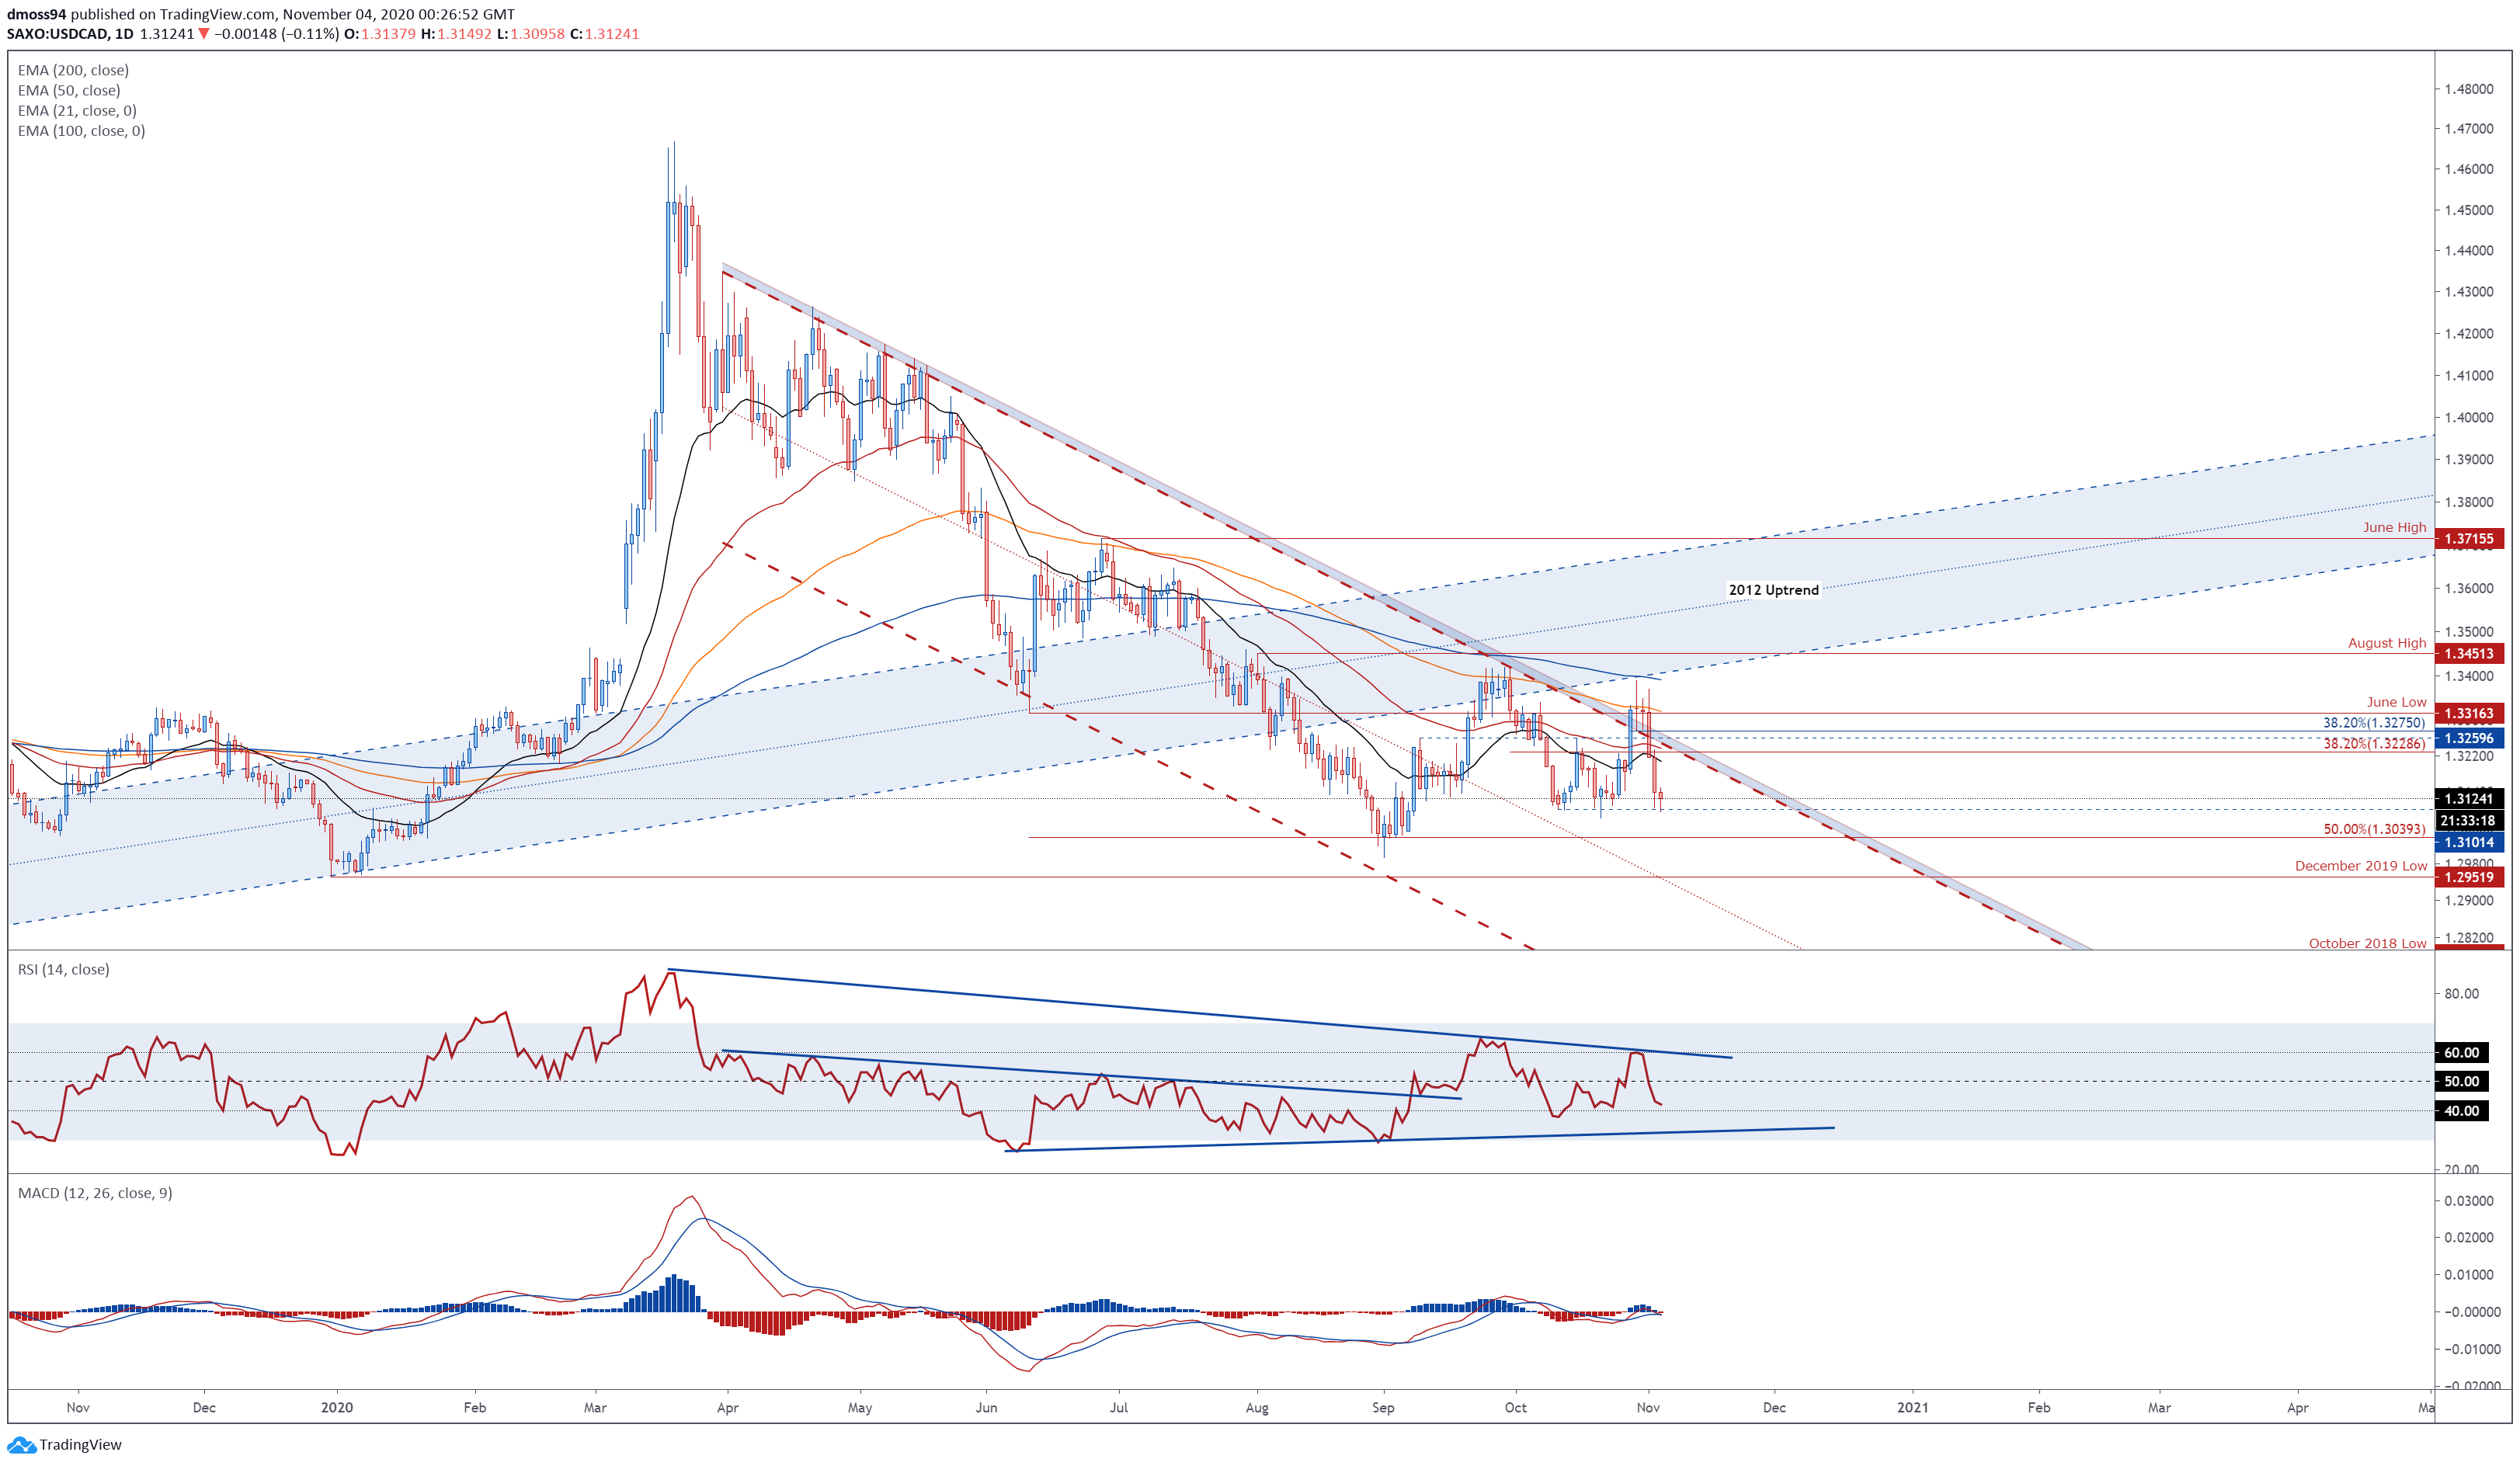
USD/CAD daily chart created using TradingView
The outlook for USD/CAD rates remains skewed to the downside as price collapses back below all four moving averages to key support at the October 12 low (1.3101).
With the MACD indicator and RSI tracking below their respective neutral midpoints, further losses could be in the offing.
A daily close below the 1.3100 mark could ignite a push to test support at the yearly low (1.2994), with a break below bringing the December 2019 low (1.3039) into focus.
On the other hand, if the October low (1.3081) holds firm a rebound back towards the 21-DMA (1.3206) and 38.2% Fibonacci (1.3228) could be on the cards.
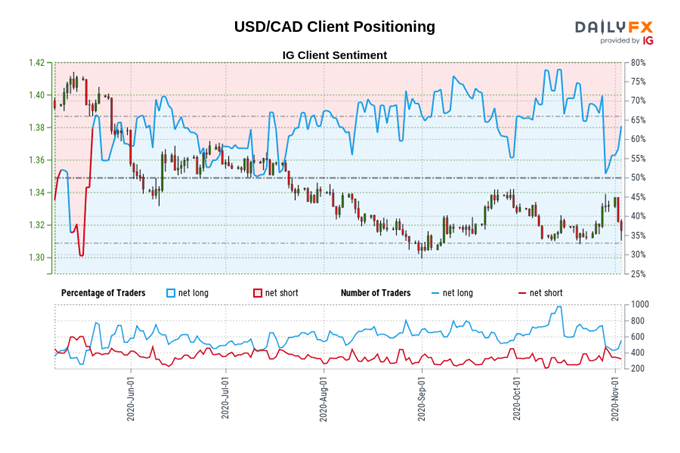
Retail trader data shows 76.18% of traders are net-long with the ratio of traders long to short at 3.20 to 1. The number of traders net-long is 18.99% higher than yesterday and 17.58% lower from last week, while the number of traders net-short is 46.81% lower than yesterday and 38.46% lower from last week.
We typically take a contrarian view to crowd sentiment, and the fact traders are net-long suggests USD/CAD prices may continue to fall.
Traders are further net-long than yesterday and last week, and the combination of current sentiment and recent changes gives us a stronger USD/CAD-bearish contrarian trading bias.
-- Written by Daniel Moss, Analyst for DailyFX
Follow me on Twitter @DanielGMoss