
US Dollar, USD, FOMC, Federal Reserve Balance Sheet – Talking Points:
- Markets tumbled early but recovered lost ground after White House trade adviser clarified US-China trade deal statements
- Could the recent contraction of the Federal Reserve’s balance sheet fuel US Dollar weakness?
- USD remains confined in Falling Wedge pattern against its major counterparts as positivity fuels risk-associated currencies.
Asia-Pacific Recap
White House trade adviser, Peter Navarro, sent markets tumbling in Asia-Pacific trade after stating the US-China trade deal was ‘over’. The trade-sensitive Australia Dollar dropped 70 pips whilst Dow Jones futures plunged as much as 2%, as investors streamed out of risk assets.
However, risk aversion proved short-lived as Navarro claimed his statement was “taken wildly out of context”, and President Donald Trump tweeted “the China Trade Deal is fully intact”, helping to quell market participants' fears.
As prices reversed back to pre-announcement levels, the intensity of the reaction seen in markets highlights the fragility of the fundamentals driving the so-called ‘recovery’, as trade tensions and coronavirus concerns wreak havoc with investor sentiment.
Looking forward, investor focus turns to flash PMI data for the EU, UK and US with an expectation that all three global powerhouses continue to show signs of economic recovery and progress. The release of the IMF’s global growth projections will also be intently scrutinized and could possibly dull the recent market positivity.

Source - TradingView
Could the Contraction of Fed’s Balance Sheet Fuel the Greenback’s Decline?
A constant need for an adequate explanation behind market movements led to intense scrutiny of the Federal Reserve’s balance sheet over recent days, as it shrank by $74 billion in the week ending June 17.
Coinciding with a decline in asset prices, and a tentative recovery in the US Dollar, had led to a preliminary assumption that perhaps, the central bank’s tapering asset purchases could be to blame.
However, breaking down the ‘Consolidated Statement of Condition’ illuminates a divergent reality, as the Federal Reserve expanded its purchase of total securities by $103 billion in the 7 days from June 10.

So, what was behind the contraction? A $92 billion reduction in liquidity swaps and a $88 billion decline in repurchasing agreements, highlighting the improvement in liquidity and Dollar-funding markets, as foreign central banks decline to ‘roll over’ USD swap lines with the Federal Reserve.
With the US Dollar surging to yearly highs in March, an assessment of the above chart could signal what underlying factors drove that historic appreciation, as demand for liquidity swaps and repurchase agreements peaked at a similar time.
Given this positive correlation, a continuation of this trend may cut short the tentative recovery seen in the Greenback last week, with falling demand for repos and swaps possibly fueling further downside for the haven-linked currency.
USD Weighted Average Daily Chart
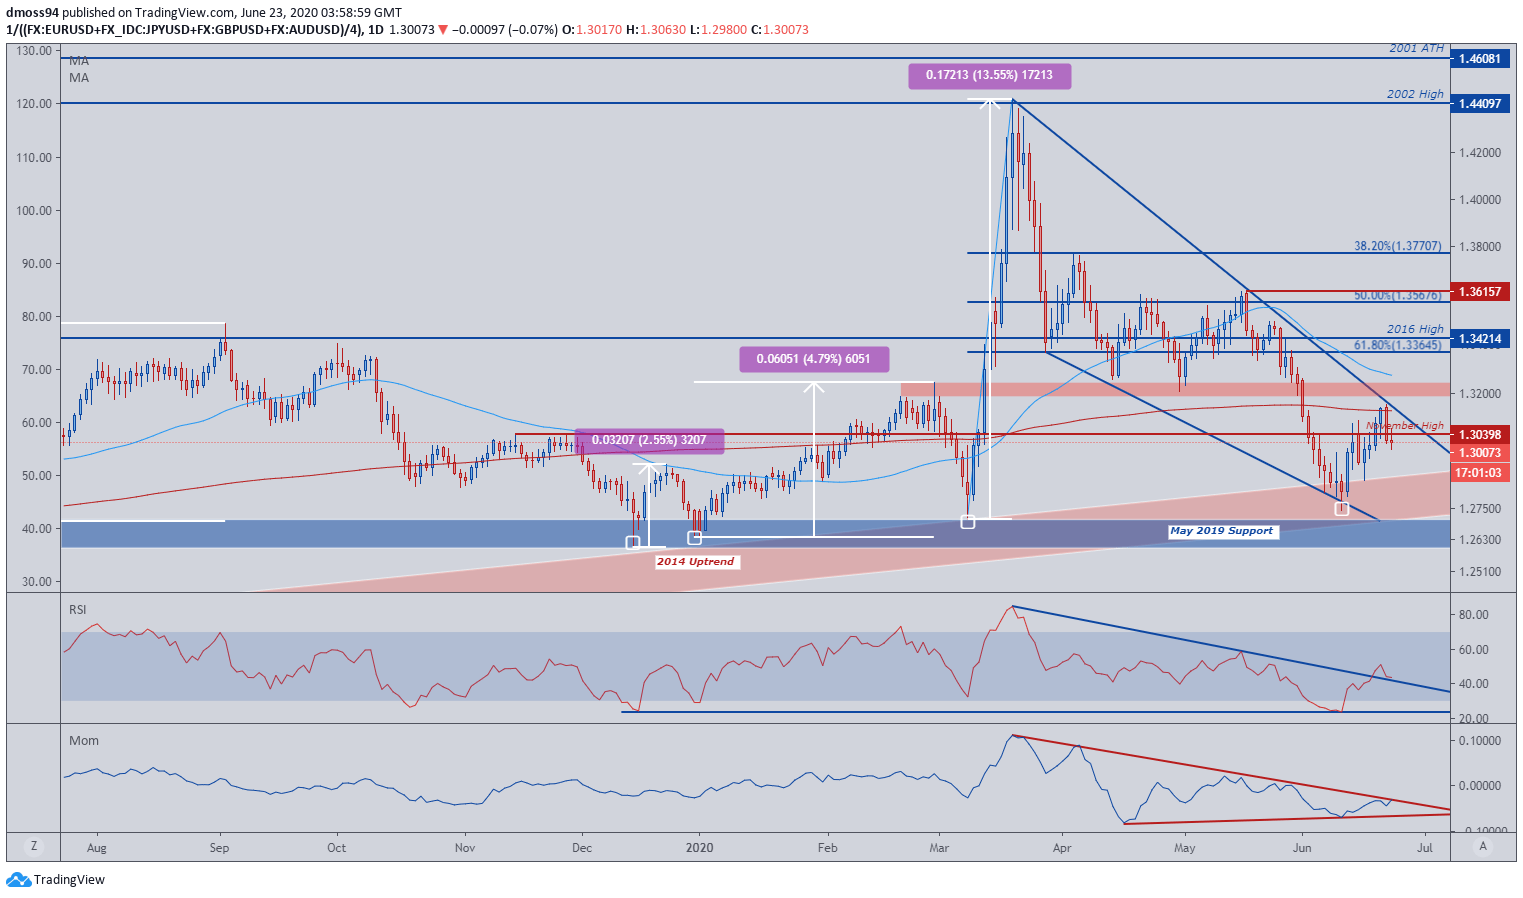
USD weighted average chart created using TradingView
The technical backdrop for the US Dollar hints at further downside, as it continues to track within a Falling Wedge pattern against its major counterparts.
Although the RSI breached the downtrend that had contained momentum since the March highs, price was unable to successfully clear the convergence of the 200-day moving average (1.3138) and wedge resistance.
The formation of a bearish engulfing candle pushed USD back through temporary support at the November high (1.3040), suggesting a retest of the June low (1.2741) may possibly eventuate.
However, technical studies suggest the remote possibility of a continuation of the 9-day uptrend as the RSI remains constructive above the ‘bearish’ zone below 40, and the momentum indicator climbs to test its 14-week downtrend.
A breach of the oscillator’s downtrend could possibly invigorate dollar bulls, eyeing a possible breakout of the bullish consolidation pattern, although a close above the 200-day moving average (1.3138) may remain a significant challenge for the greenback.
-- Written by Daniel Moss
Follow me on Twitter @DanielGMoss