US Dollar Talking Points:
- The US Dollar showed weakness around last week’s election results.
- The USD put in a long-term trendline test to close last week; and so far this week bulls have remained in charge each day through early-Wednesday trade.
- The analysis contained in article relies on price action and chart formations. To learn more about price action or chart patterns, check out our DailyFX Education section.
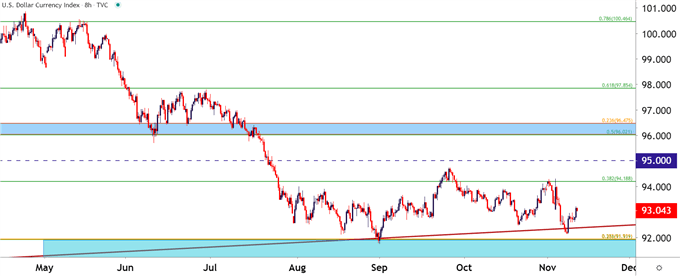
The US Dollar saw heavy selling last week on the back of the US Presidential Election, helping to reverse the late-October flare of strength that saw DXY push up to Fibonacci resistance.
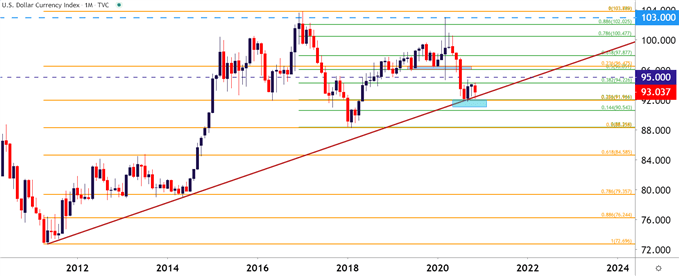
But, so far this week – that sell-off in USD has went on pause as a long-term area of support has helped to hold the lows. At issue is a trendline projection generated from 2011 and 2014 swing-lows; the projection of which helped to catch support in DXY in early-September. At the time, the trendline was confluent with another couple of support items, producing an element of confluence around the 92.00 area on DXY. That support inflection held then and the more recent iteration has so far done the same – the big question now is whether sellers can take-over again.
To learn more about drawing trendlines, join us in DailyFX Education
US Dollar Monthly Price Chart

Chart prepared by James Stanley; USD, DXY on Tradingview
Taking a closer look at the USD, and below this trendline projection remains a couple of confluent Fibonacci levels that could offer follow-through support should the trendline be tested through. Both the 23.6% Fibonacci retracement of the 2017-2018 major move and the 38.2% retracement of the 2011-2017 major move plot within very tight proximity of the 92.00 handle. Below that – there’s little in the way down to the 90.49 level.
On the resistance side of the coin – the 38.2% retracement of the 2017-2018 major move is what’s currently helping to mark the November highs after it caught resistance last week. And above that is the 95.00 psychological level followed by another confluent zone spanning from 96 up to 96.48.
US Dollar Eight-Hour Price Chart

Chart prepared by James Stanley; USD, DXY on Tradingview
--- Written by James Stanley, Strategist for DailyFX.com
Contact and follow James on Twitter: @JStanleyFX

